Jennell_McIntire
Employee
Employee

@What does the TOTAL qualifier do when used in a chart expression?  I have used TOTAL in an expression when I want to perform an aggregation across all dimensions.  For instance, if I need to show the percentage of employees in a specific office in a KPI object, I would use the TOTAL qualifier in an expression like this:

expression1.png

Paris.png

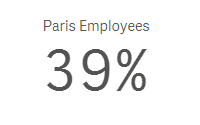
I would sum the number of employees in the Paris office and divide that by the total number of employees across all offices.  In this expression, TOTAL disregards the dimension value (which is City in this case) and adds all employees.  Now if I make a selection in my app and select Paris, then my KPI would change to 100% because the total is based on the possible field values.  To get around this, I can add set analysis to the expression to look at the data before any selections were made.  The expression would look like the expression below and would remain 39% even if city selections are made.

expression2.png

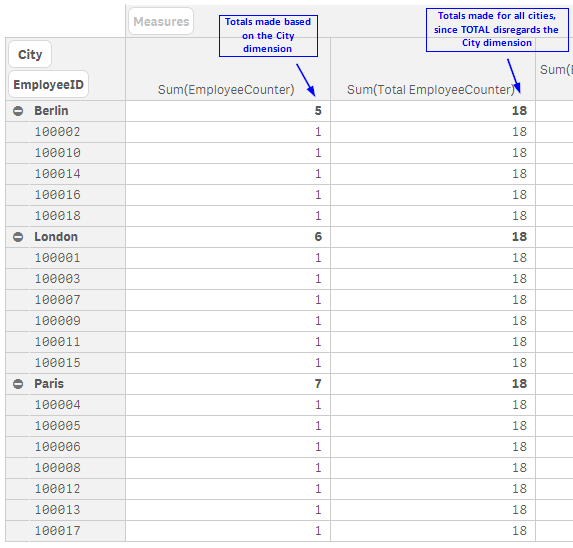
I often use the TOTAL qualifier in KPI objects when I need to highlight a value but it can be used in any chart expression.  In the pivot table below, you can see how an expression value can differ with the use of TOTAL.

pivot.png

The TOTAL qualifier is useful when you want to see the shares of something similar to when you use a pie chart to see the percentage of parts that make up the whole.  In my case, it is helpful when I want to see the shares without making a selection first.  Henric Cronstrom wrote a great blog on The Aggregation Scope which talks about this topic is more detail.

Thanks,

Jennell

13 Comments
ziadm
Specialist
Specialist

Very  much useful hint .. Thanks

0 Likes
19,338 Views
MK_QSL
MVP
MVP

Thanks for sharing... We can also use ALL instead of {1}TOTAL

SUM({<City = {'Paris'}>}EmployeeCounter)/SUM(ALL EmployeeCounter)

19,338 Views
rwunderlich
Partner Ambassador/MVP

I think ALL is tolerated for backwards compatibility, but is not recommended  for new expressions. From the current Help: "For legacy reasons, the all qualifier will still work in this QlikView version, but may be removed in coming versions."

19,338 Views
anderseriksson
Partner - Specialist

Also useful is that you can add a dimension to TOTAL in order to get the total aggregation with respect to that dimensional field.

In the above example it might be useful to have the expression;

Sum(TOTAL <City> EmployeeCounter)

would give the values 5,6,7 for all rows in respective City.

With something else as second dimension or maybe a sales amount as aggregated value this might be useful to calculate the percentage within each City.

19,338 Views
Not applicable

I am wondering if this will work for my challenge - this is what I am struggling with:

I am trying to aggregate manager level metrics based on the resource compliance - not the average of the resources.

Example data:
Resource 1 - 112% - Yellow
Resource 2 - 105% - Green
Resource 3 - 130% - Red
Resource 4 - 74% - Red
Resource 5 - 60% - Red


If I were to average these 5 I would get 96.2% - falling in the Green - but the
details reflect the problems and needs to be reflected as 60% are red and 20%
are yellow.

Ranges:
Green - from 90-110
Yellow - from 80-90 and 110 to 120
Red - 0-80 and 120 and above


We have a count of red, yellow and green at the resource level but are
struggling how to roll up and aggregate at a manager level. This is for a large
organization with lots of managers.

0 Likes
19,338 Views
Not applicable

Very useful

0 Likes
19,338 Views
silambarasan
Creator II
Creator II

Super!

0 Likes
15,857 Views
NareshGuntur
Partner - Specialist

To get around this, I can add set analysis to the expression to look at the data before any selections were made.  The expression would look like the expression below and would remain 39% even if city selections are made.

https://community.qlik.com/servlet/JiveServlet/showImage/38-4160-83992/expression2.png

I am just thinking doesn't Sum({<City = {'Paris'}>}EmployeeCounter)/Sum({1}EmployeeCounter) alone will help so that the external selections will not impact the figure 39%.

I am just trying to understand if there is any difference if I remove TOTAL qualifier.

Cheers,

Naresh

0 Likes
15,854 Views
Not applicable

Thanks Jennell...This is highly informative!

0 Likes
15,854 Views
tajmohamed30
Creator III
Creator III

thank you so much

0 Likes
15,856 Views