Unlock a world of possibilities! Login now and discover the exclusive benefits awaiting you.
- Qlik Community
- :
- Discover
- :
- Blogs
- :
- Product
- :
- Design
- :
- What’s new in Qlik Sense 3.0 - Time-aware Charts
- Subscribe to RSS Feed
- Mark as New
- Mark as Read
- Bookmark
- Subscribe
- Printer Friendly Page
- Report Inappropriate Content
One of my personal favs and long time awaited features that ships with Qlik Sense 3.0 is the new time-aware charts.
We could simply describe it as continuous scale in x-axis line chart but it’s much more than that, let me show it to you.
Before the introduction of Qlik Sense 3.0 Time-aware charts, line charts displaying a time dimension in the X-axis would show a portion of the line at a reasonable scale although the complete sequence was still visible in the mini-chart at the bottom of the object.
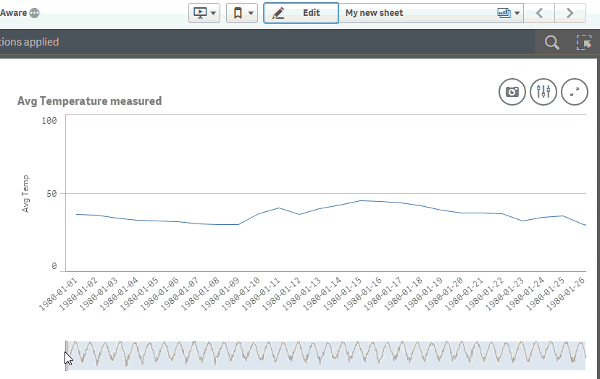
Time-aware charts are visualizations that use a continuous scale to provide a complete and accurate view of time-based data. That is, when you enable continuous scaling on the x-axis in a chart with date fields, data points are separated from each other by a distance relative to their associated time. As well, the axis labels are evenly separated whether or not there is data for that point and the chart view is compressed to avoid scrolling.
You can zoom in, zoom out or modify the size of the visible window that appears over the mini-chart at the bottom of the object to get a closer look into the data. As you can see in the animation above, content gets immediately adjusted showing the relevant x-axes label information at any zoom level.
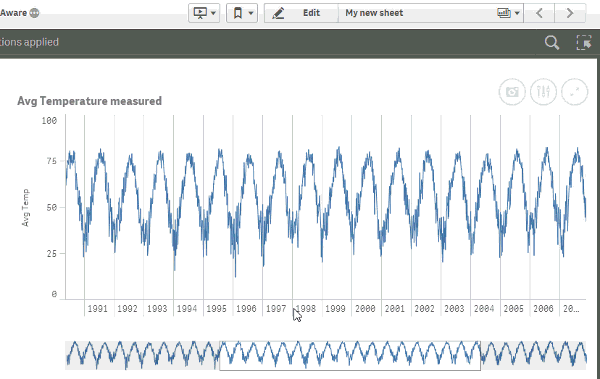
Selections are smart as well, when browsing the chart at a yearly level any selection in the chart will perform a selection in the year derived field, but when a more detailed view of the data is visible, for example at day level, selections will be performed in day (derived) field in the data model.
How to get it working?
Time-aware charts needs, of course, a time dimension to work. Good thing is since Qlik Sense 1.1 we can declare and derive time fields in our data model. Read Jennell’s blog post to learn how to do it. Alternatively, if you are loading data using the data load wizard, then chances are Qlik Sense will automatically detect your field(s) containing a date and it will do the rest for you.
Once you have your time dimension working the next step will be pretty straightforward, as shown in the animation above you just need to activate it by checking the box “Use continuous scale”.
Thanks,
Arturo
You must be a registered user to add a comment. If you've already registered, sign in. Otherwise, register and sign in.