hic
Former Employee
Former Employee

How normalized should the QlikView data model be? To what extent should you have the data in several tables so that you avoid having the same information expressed on multiple rows?


Usually as much as possible. The more normalized, the better. A normalized data model is easier to manage and minimizes the risk of incorrect calculations.


This said, there are occasions where you need to de-normalize. A common case is when the source database contains a generic master table, i.e. a master table that is used for several purposes. For example: you have a common lookup table for customers, suppliers, and shippers. Or you have a master calendar table that is used for several different date fields, e.g. order date and shipping date (see image below).


DB Relations.jpg


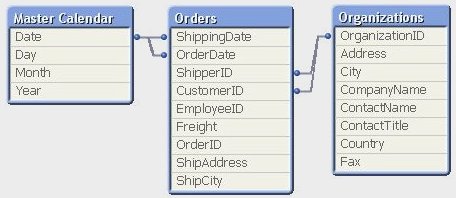
A typical sign for this situation is that the primary key of the master table links to several foreign keys, sometimes in different parts of the data model. The OrganizationID links to both CustomerID and ShipperID and the Date field links to both OrderDate and ShippingDate. The master table has several roles.


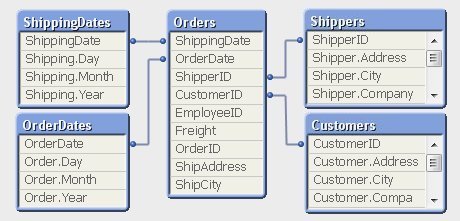
The necessary de-normalization in QlikView is easy. You should simply load the master table several times using different field names, once for every role. (See image below).


QV Relations.jpg


However, loading the same data twice is something many database professionals are reluctant to do; they think that it creates an unnecessary redundancy of data and hence is a bad solution. So they sometimes seek a solution where they can use a generic master table also in the QlikView data model. This is especially true for the master calendar table.


If you belong to this group, I can tell you that loading the same table several times is not a bad solution.  Au contraire – in my opinion it is the best solution. Here's why:

  1. From the user’s perspective it is confusing to have an unspecified “Date” field if there are several dates in the data model. For example, the user will not understand whether the date refers to order date or shipping date.
  2. Without loading the master calendar several times, it will not be possible for the user to make selections that place simultaneous restrictions on several date fields, e.g. “show transactions where the order was placed in September and the items were shipped in November”.


In fact, loading the same table several times in QlikView is no stranger than doing it in SELECT statements using aliases, e.g.,

SELECT OrderID FROM Orders
INNER JOIN MasterCalendar AS OrderCalendar ON Orders.OrderDate=OrderCalendar.Date
INNER JOIN MasterCalendar AS ShippingCalendar ON Orders.ShippingDate=ShippingCalendar.Date
WHERE OrderCalendar.Month=9 AND ShippingCalendar.Month=11


In SQL you would never try to solve such a problem without joining the master table twice. And you should do the same in QlikView.


So, if you have several dates in your data model – load the master calendar several times!


HIC


PS. But if you still want one common date field, you should create a Canonical Date.

13 Comments
Not applicable

I agree the part of the user experience. How ever, if you select all items of a sertain year or month, you do not want to redo this selections on each sheet over and over again.

Is there a simple solutions for this, without creating sync / loop problems

0 Likes
18,652 Views
hic
Former Employee
Former Employee

In my experience, you rarely want to make exactly the same selection in two different date fields. It is much more common that you want different selections in e.g. OrderDate and ShippingDate.

Further, making the selection in only one of the fields is usually enough. It reduces the data properly and it is visible on all sheets. If you e.g. make a selection in ShippingQuarter to see all shipments for Q3, you will most likely reduce the possible OrderDates also. Most orders will also be in Q3, due to nature of the business. The odd orders that are earlier are in fact the most interesting ones since you in them could find cases where the shipment has been delayed.

What you could do, is to define a field displaying the delay, i.e. the time difference between order and shipment already in the script:

   ShipmentDate - OrderDate as ShipmentDelay

If you now combine a selection in OrderDate with one in ShipmentDelay you do not need to make a selection in ShipmentDate.

HIC

18,652 Views
datanibbler
Champion
Champion

Great blog!

I made the same experience, albeit only with a master_calendar, not with a masterdata_table yet: I had the requirement to display certain data as per two different dates - since I could not make two different linkages between that table and the master_calendar, I had to generate another calendar just for this purpose.

I can easily imagine a scenario where the need for that de-normalization would occur, however.

The limitations concerning the linking of tables is IMHO one of the mayor drawbacks of QlikView - equality of fieldnames is rarely relevant - take SAP as an example 😉 Because of QlikView's tendency to automatically link fields by their name, you cannot be more specific and e.g. build several different linkages...

0 Likes
18,652 Views
Not applicable

Thanks for directing me to this - Great discussion.

So, the only issue I see with this approach, is how to graph shipments vs orders over time?  That's a pretty common requirement, in my experience.  I am thinking it would be a good QV enhancement to "alias" a single dimension, so that this could be handled (unless there is another way).  In other tools, you build a single canonical calendar dimension, and alias to that by way of a metadata layer which resolves these issues..

0 Likes
18,652 Views
hic
Former Employee
Former Employee

Well spotted. Yes, you need a canonical calendar to use two different dates as common x-axis in a chart. And you can have this in addition to the other calendars. Do the following:

BridgeTable:

Load OrderID, OrderDate as Date, 'Order' as DateType Resident Orders;

Load OrderID, ShippingDate as Date, 'Shipping' as DateType Resident Orders;

Then attach your canonical calendar to this canonical Date field.

Now use the following chart expressions:

Count({$<DateType={'Order'}>} distinct OrderID) as OrderCount

Sum({$<DateType={'Shipping'}>} Amount) as ShippedAmount

HIC

See more on Canonical Date

18,652 Views
Not applicable

Henric,

That looks great. I like that better, rather than the multi-master

calendar approach. In my opinion, it's cleaner, and the user does not

have to think.

So, basically, you are splitting a single row in the "master order fact"

into 2 rows in the master order fact bridge, if I am understanding you

correctly. I am guessing the master order fact has no joins to the

MasterCalendar. I like the "lean" bridge table, as it only has the columns

it needs.

Question - Could adding other dimensions (Ex. customer) into the analysis

lead to "double counting or summing" of the master order facts meaures, due

to the join to the bridge?

Dave

On Thu, Jan 23, 2014 at 9:12 AM, Henric Cronström

0 Likes
18,652 Views
hic
Former Employee
Former Employee

Yes, it's simpler for the user, but - you also lose some logic. Say, for instance that you want to select "ordered in September, but delivered in November". How would you do that without the multi-calendar approach? I would use both approaches.

On double counting: If you keep the bridge table and the fact table apart, there will normally be no double counting. But joint them, and you will get double counting. The expression will be evaluated in the context of the fields used, i.e. Sum(Amount) will sum in the table where "Amount" is found. But if the aggregation function contains several fields from different tables, e.g. Sum(If(Month='Dec',Amount)), then the aggregation will run over the product of the tables, and then you might get double counting.

HIC

0 Likes
14,191 Views
Not applicable

Interesting - did not think of that.

I am going to test those scenarios out - should be allot of fun

These kinds if things are really valuable, as they stress test QV.

Dave

On Thu, Jan 23, 2014 at 10:27 AM, Henric Cronström <qcwebmaster@qlik.com

0 Likes
14,191 Views
Not applicable

Hi Henric,

I agree with the approach with you mentioned for the above example but for Clinical Trial Systems , this approach would not work. I have attached a snapshot of small CTMS system datamodel. There are many dates which I have missed in each table. Taking this as an example how can we implement the below use cases:

1. How to table started Studies, their corresponding started sites and patients over month? All of them should have the same started/enrollment month.

2. How to table ended Studies, their corresponding ended sites and patients over month?

We have implemented this by using island master calendar with each expression using set analysis based on selected month. The dashboard performs well because the data size is small but it will give problem over time. Can you please suggest any better solution keeping in mind that that there are many other entities like Disease, Events, Principal Investigator having multiple dates and their are many such matrices need to be crated based on different date.

I think we cannot create so many role playing date dimension in this case.

ClinicalTrialDatesEg.JPG.jpg

Thanks,

Anosh

0 Likes
14,191 Views
Not applicable

Hi Henric,

Did you get a chance to see my scenario above?

Regards,

Anosh

0 Likes
14,191 Views