Unlock a world of possibilities! Login now and discover the exclusive benefits awaiting you.
- Subscribe to RSS Feed
- Mark as New
- Mark as Read
- Bookmark
- Subscribe
- Printer Friendly Page
- Report Inappropriate Content
A number alone doesn't tell you very much – you need to compare it with something. And very often you want to compare this year’s number with last year’s.
It is called Year-over-Year (YoY).
In such a comparison, you can for example compare the sales of the current month with the sales for the same month last year. Or – if you want to avoid fluctuations due to good or bad months, you instead look at the accumulated sales in the current year compared the same period last year. Then you look at the Year-to-Date (YTD) number.
But how do you calculate it? How do you write a simple formula that picks out a subset of transactions from last year and compares them to the corresponding transactions from the current year?
If you have Month as dimension and show accumulated numbers in the chart, you don’t need to do anything. The numbers are comparable as they are.
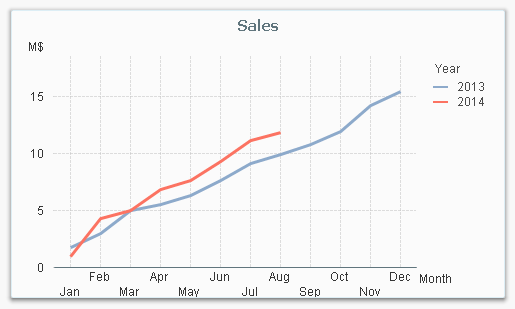
However, if you don’t use Month as dimension, the numbers will no longer be comparable since last year contains transactions from a longer period. You still may want to make the comparison, but with another first dimension and Year as the second.
There are several ways to do this, and they differ in how the reference date is defined. One way is to let the user define an arbitrary reference date – either through a selection or through a variable – and then use this is an advanced Set Analysis expression.
Another, much simpler way is to use the date of the script run as reference date. If your application is refreshed every night, this would mean that the Year-to-Date calculation always is up until today’s date.
Here’s how you do it:
In your Master Calendar you should define flags – Boolean fields – that define whether or not a specific date should be included in the calculation:
If( DayNumberOfYear(Date) <= DayNumberOfYear(Today()), 1, 0 ) as IsInYTD,
The above formula tests whether the date falls before today’s date or not. Note that this flag will be useful also for dates belonging to other years than the current. The value of the flag will be 1 for dates in the beginning of the year irrespective of which year it is.
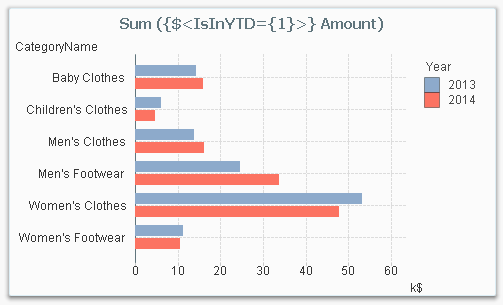
Then you can use this flag in a simple Set Analysis expression:
Sum( {$<IsInYTD={1}>} Amount )
The Set Analysis expression will pick out the correct dates and thus the correct transactions for the comparison. Further, this expression can be combined with any dimensions.
Flags for a number of different time periods can be created like this, not just Year-to-Date, but also Quarter-to-Date, Month-to-Date, Current Month, Last Month, etc.
If( DayNumberOfQuarter(Date) <= DayNumberOfQuarter(Today()), 1, 0) as IsInQTD,
If( Day(Date) <= Day(Today()), 1, 0) as IsInMTD,
If( Month(Date) = Month(Today()), 1, 0) as IsCurrentMonth,
If( Month(AddMonths(Date,1)) = Month(Today()), 1, 0) as IsLastMonth,
Summary: Create the necessary flags in your Master Calendar. It will simplify your Set Analysis expressions tremendously.
You must be a registered user to add a comment. If you've already registered, sign in. Otherwise, register and sign in.