Unlock a world of possibilities! Login now and discover the exclusive benefits awaiting you.
Design
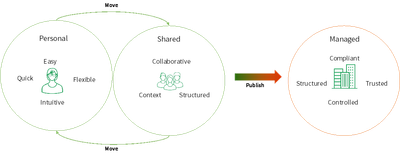
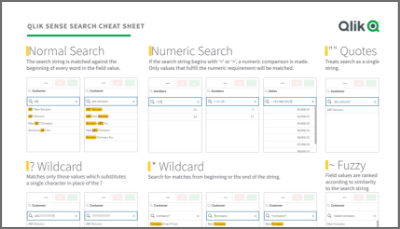
The Design blog is all about product and Qlik solutions, such as scripting, data modeling, visual design, extensions, best practices, and more!
- Qlik Community
- :
- Discover
- :
- Blogs
- :
- Product
- :
- Design
- :
- Design - Page 23
Options
- Mark all as New
- Mark all as Read
- Float this item to the top
- Subscribe
- Bookmark
- Subscribe to RSS Feed
Design - Page 23
Turn on suggestions
Auto-suggest helps you quickly narrow down your search results by suggesting possible matches as you type.
Showing results for


Subscribe by Topic