Unlock a world of possibilities! Login now and discover the exclusive benefits awaiting you.
- Qlik Community
- :
- Discover
- :
- Programs
- :
- Education
- :
- Qlik Education Discussions
- :
- Re: 100% Stacked bar chart in Qlik Sense
- Subscribe to RSS Feed
- Mark Topic as New
- Mark Topic as Read
- Float this Topic for Current User
- Bookmark
- Subscribe
- Mute
- Printer Friendly Page
- Mark as New
- Bookmark
- Subscribe
- Mute
- Subscribe to RSS Feed
- Permalink
- Report Inappropriate Content
100% Stacked bar chart in Qlik Sense
Dear Community
I wonder how can I build a 100% Stacked bar chart in Qlik Sense. My case is the follows.
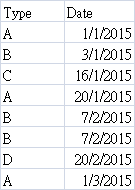
The result I want is to measure the number of occurrences of Type in Month.
However, I don't know how to build it in Qlik sense.As I already set:
Dimensions:
1. Month (Date)
2. Type
Style = stacked
Show in percent
Static max 1
How can I set the expression in Measures?
Thank you very much. Please give me a helping hand.
Accepted Solutions
- Mark as New
- Bookmark
- Subscribe
- Mute
- Subscribe to RSS Feed
- Permalink
- Report Inappropriate Content
Hi
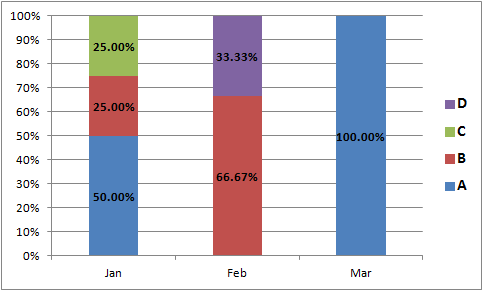
Use a Stacked Bar Chart with two dimensions (Month,Type)
and the following Measure
Count(Type) / Count(total <Month> Type)
With Custom Number formatting (#,##0%)
You should end up with something like this.
- Mark as New
- Bookmark
- Subscribe
- Mute
- Subscribe to RSS Feed
- Permalink
- Report Inappropriate Content
Hi
Use a Stacked Bar Chart with two dimensions (Month,Type)
and the following Measure
Count(Type) / Count(total <Month> Type)
With Custom Number formatting (#,##0%)
You should end up with something like this.
- Mark as New
- Bookmark
- Subscribe
- Mute
- Subscribe to RSS Feed
- Permalink
- Report Inappropriate Content
Nils Morris Thank you very much for help.
However, in my case, my original data format in date is in a whole date (1/1/2015) not only a month (1).
Apart from changing the original data format in Excel from Date to Month, How can I do the data transforming from Date to Month and available to use in the Measure in Qlik Sense?
Dimensions:
1. Month (Date)
2. Type
If I type
Measure: count(Type) / count( TOTAL <Date> Type)
The result is not I want to be as it count the Type per month over the Total type of all records.
If I type
Measure: count(Type) / count( TOTAL <Month (Date)> Type)
It can't show any thing because it is wrong expression.
Thank you very much for answering.
- Mark as New
- Bookmark
- Subscribe
- Mute
- Subscribe to RSS Feed
- Permalink
- Report Inappropriate Content
Hi
Do the tranforming step in your load script and then use the created field (Month) in previous example.
If you need help navigating to the load script let me kmow and I will help.
LOAD
Type,
"Date",
Month("Date") As Month
FROM [lib://Desktop/Test.xls]
(biff, embedded labels, table is Sheet2$);
- Mark as New
- Bookmark
- Subscribe
- Mute
- Subscribe to RSS Feed
- Permalink
- Report Inappropriate Content
Nils Morris Thank you very much. I am able to create the 100% stacked bar chart and the field form data load editor that I want in Qlik Sense.  You are very smart and very nice for helping me. Much Thanks
 .
.