Unlock a world of possibilities! Login now and discover the exclusive benefits awaiting you.
- Qlik Community
- :
- Discover
- :
- Programs
- :
- Education
- :
- Qlik Education Discussions
- :
- Re: 12 month roll
- Subscribe to RSS Feed
- Mark Topic as New
- Mark Topic as Read
- Float this Topic for Current User
- Bookmark
- Subscribe
- Mute
- Printer Friendly Page
- Mark as New
- Bookmark
- Subscribe
- Mute
- Subscribe to RSS Feed
- Permalink
- Report Inappropriate Content
12 month roll
Hi,
Can anyone help me create an expression for measuring 12 rolling sales.
Thomas
- « Previous Replies
-
- 1
- 2
- Next Replies »
- Mark as New
- Bookmark
- Subscribe
- Mute
- Subscribe to RSS Feed
- Permalink
- Report Inappropriate Content
Hi Thomas,
Here's an example of a 3 month rolling average using the rangesum and above functions. Hopefully you can adapt this to you setup.
This article by gwassenaar is also a great resource:
Calculating rolling n-period totals, averages or other aggregations
Best,
Matt
- Mark as New
- Bookmark
- Subscribe
- Mute
- Subscribe to RSS Feed
- Permalink
- Report Inappropriate Content
Hi Matt,
Thanks for your reply.
It issue with this is that when you choose a specific month it shows the sales for that month and not the 3 month rolling avg.
Regards,
Thomas
- Mark as New
- Bookmark
- Subscribe
- Mute
- Subscribe to RSS Feed
- Permalink
- Report Inappropriate Content
Ok, what about ignoring the date dimension like this:
rangeavg(above(sum({<YourDateField = >}Sales),0,3))
Best,
Matt
- Mark as New
- Bookmark
- Subscribe
- Mute
- Subscribe to RSS Feed
- Permalink
- Report Inappropriate Content
Hi Thomas, try with this set analysis in your expression: Month= {">=$(=max(Month)-12)<=$(=max(Month))"}
Hope it helps you!
Regards!
- Mark as New
- Bookmark
- Subscribe
- Mute
- Subscribe to RSS Feed
- Permalink
- Report Inappropriate Content

I can't really ignore the date dimension since I will choose a specific month to see numbers for that month.
Thomas
- Mark as New
- Bookmark
- Subscribe
- Mute
- Subscribe to RSS Feed
- Permalink
- Report Inappropriate Content
In this.
Rangeavg(above(sum({<Month = >} Sales), 0,12))
?
- Mark as New
- Bookmark
- Subscribe
- Mute
- Subscribe to RSS Feed
- Permalink
- Report Inappropriate Content
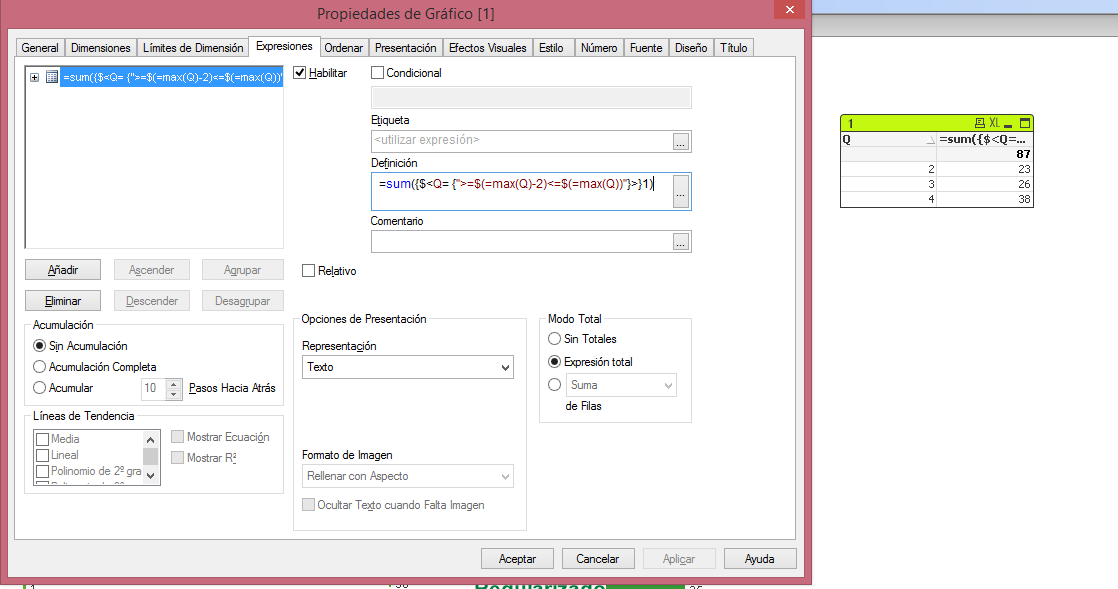
There is a little example, I use Q (1,2,3,4) as dimension, and a simple sum with the expression given in the last post. The dimension will be filtered by the range in the expression
Hope it helps!
Regards!
- Mark as New
- Bookmark
- Subscribe
- Mute
- Subscribe to RSS Feed
- Permalink
- Report Inappropriate Content
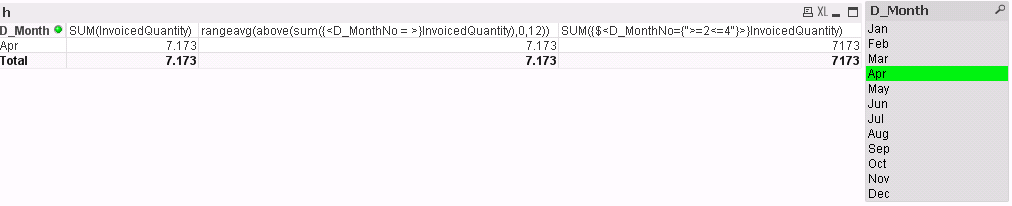
Hmm....this gives me the same as a simple SUM.
:
- Mark as New
- Bookmark
- Subscribe
- Mute
- Subscribe to RSS Feed
- Permalink
- Report Inappropriate Content
So you need a total InvoiceQuantity of the last 12 months in a single row?
- « Previous Replies
-
- 1
- 2
- Next Replies »