Unlock a world of possibilities! Login now and discover the exclusive benefits awaiting you.
- Qlik Community
- :
- Discover
- :
- Programs
- :
- Education
- :
- Qlik Education Discussions
- :
- Re: How to to club two expressions from a set of f...
- Subscribe to RSS Feed
- Mark Topic as New
- Mark Topic as Read
- Float this Topic for Current User
- Bookmark
- Subscribe
- Mute
- Printer Friendly Page
- Mark as New
- Bookmark
- Subscribe
- Mute
- Subscribe to RSS Feed
- Permalink
- Report Inappropriate Content
How to to club two expressions from a set of four into a pair of stacked bar chart
Hi,
I have a requirement to display the following in a bar chart.
Dimension:
Month
Expressions:
1. Open Tickets
2. Closed tickets
3. Open tickets for department A
4. Closed tickets for department A
The bar chart should have two bars " Open ticket and Closed ticket" being displayed for a single dimension "Month" but the bars should be stacked and display 'Open tickets for department A' and 'Closed tickets for department A' in the respective two bars itself.
Looking for a solution to this problem. Is it feasible?
Accepted Solutions
- Mark as New
- Bookmark
- Subscribe
- Mute
- Subscribe to RSS Feed
- Permalink
- Report Inappropriate Content
- Mark as New
- Bookmark
- Subscribe
- Mute
- Subscribe to RSS Feed
- Permalink
- Report Inappropriate Content
Could you attached your data/file?
- Mark as New
- Bookmark
- Subscribe
- Mute
- Subscribe to RSS Feed
- Permalink
- Report Inappropriate Content
Hi Robert,
Won't be able to attach the data/qvw but attaching a snapshot of how the bar chart looks for the four expressions. (Snip.jpg)
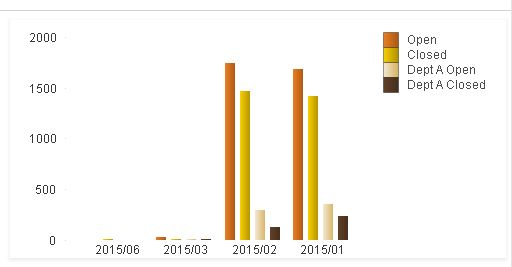
The data for 'Dept A Open' and 'Dept A Closed' is a subset of the entire data set for 'Open tickets' and 'Closed tickets' respectively.
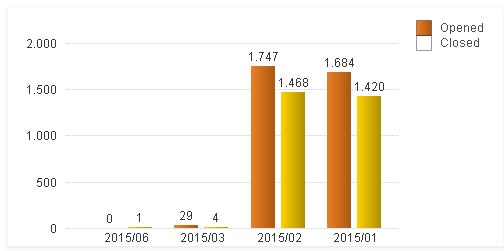
The objective is to try and show the subsets in a pair of bars for the 'Open tickets' and 'Closed tickets' (Snip2.jpg) as a stacked bar chart generally looks like
- Mark as New
- Bookmark
- Subscribe
- Mute
- Subscribe to RSS Feed
- Permalink
- Report Inappropriate Content
Hi Bhupesh,
please see the attached.
Regards
Andy
- Mark as New
- Bookmark
- Subscribe
- Mute
- Subscribe to RSS Feed
- Permalink
- Report Inappropriate Content
Hi Andrew,
I had a look at your expressions in the qvw.
The value of Sum(DeptAOpen) and sum(DeptAClosed) should be speparately visible in the same two bars of the graph- “All Open” and “All Closed” but with a different colour so that they can be identified.
- Mark as New
- Bookmark
- Subscribe
- Mute
- Subscribe to RSS Feed
- Permalink
- Report Inappropriate Content
You have similar problem with solution here:
- Mark as New
- Bookmark
- Subscribe
- Mute
- Subscribe to RSS Feed
- Permalink
- Report Inappropriate Content
Solution found