Unlock a world of possibilities! Login now and discover the exclusive benefits awaiting you.
- Qlik Community
- :
- Discover
- :
- Programs
- :
- Education
- :
- Qlik Education Discussions
- :
- Re: Showing Data points values saperately
- Subscribe to RSS Feed
- Mark Topic as New
- Mark Topic as Read
- Float this Topic for Current User
- Bookmark
- Subscribe
- Mute
- Printer Friendly Page
- Mark as New
- Bookmark
- Subscribe
- Mute
- Subscribe to RSS Feed
- Permalink
- Report Inappropriate Content
Showing Data points values saperately
Hi all,
In bar chart i want to display data points values separately for each expression.
I have two expression, when i am selecting Values on Data points option it is showing sum of both expressions.
I want to show values separately for each expression. The chart is stacked.
Could anyone help me pls.
Thanks,
Shailesh
- Mark as New
- Bookmark
- Subscribe
- Mute
- Subscribe to RSS Feed
- Permalink
- Report Inappropriate Content
could you please attch your app.
Thanks
- Mark as New
- Bookmark
- Subscribe
- Mute
- Subscribe to RSS Feed
- Permalink
- Report Inappropriate Content
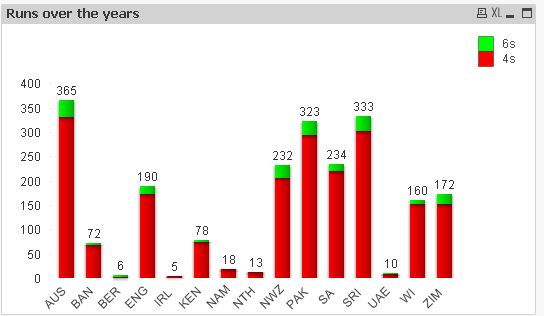
Below is the graph. Showing number of 4s & 6s team wise. But value on data points are sum of both 4s and 6s.
For Ex: Against AUS 365 is total number of 4s & 6s. I want to show number of 4s & 6s Separately as data points.
Thanks,
Shailesh
- Mark as New
- Bookmark
- Subscribe
- Mute
- Subscribe to RSS Feed
- Permalink
- Report Inappropriate Content
Hi,
Here i have attached sample qvw.
hope this will satisfy your requirement.