Unlock a world of possibilities! Login now and discover the exclusive benefits awaiting you.
- Qlik Community
- :
- Discover
- :
- Programs
- :
- Education
- :
- Qlik Education Discussions
- :
- Trendline in Straight Table
Options
- Subscribe to RSS Feed
- Mark Topic as New
- Mark Topic as Read
- Float this Topic for Current User
- Bookmark
- Subscribe
- Mute
- Printer Friendly Page
Turn on suggestions
Auto-suggest helps you quickly narrow down your search results by suggesting possible matches as you type.
Showing results for
Not applicable
2014-12-18
11:44 AM
- Mark as New
- Bookmark
- Subscribe
- Mute
- Subscribe to RSS Feed
- Permalink
- Report Inappropriate Content
Trendline in Straight Table
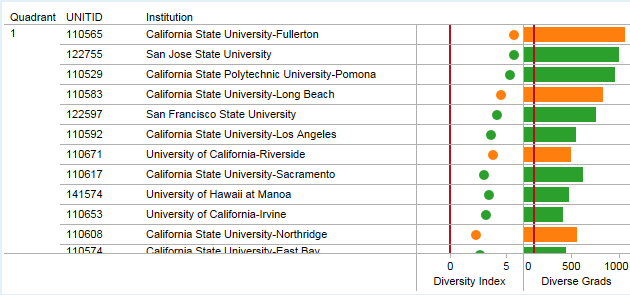
Is it possible to have a vertical trendline in a linear gauge that crosses rows in a straight table. Basically I want to show the average line across rows so that a user can see a rows value compared to the average. I can do this in Tableau very easily (see red line in chart below) but have not figured out how to do it in Qlikview. Any help would be greatly appreciated.
626 Views
1 Reply
2014-12-18
12:06 PM
- Mark as New
- Bookmark
- Subscribe
- Mute
- Subscribe to RSS Feed
- Permalink
- Report Inappropriate Content
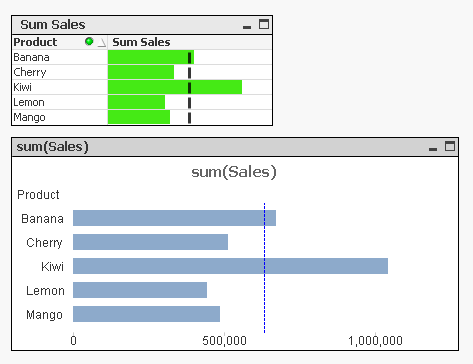
It's not possible to add reference lines to a linear gauge. You can try putting two chart objects on top of each other. Or just use a bar chart instead so that you can add the reference line.
talk is cheap, supply exceeds demand
303 Views
Community Browser