Unlock a world of possibilities! Login now and discover the exclusive benefits awaiting you.
- Qlik Community
- :
- Discover
- :
- Programs
- :
- Education
- :
- Qlik Education Discussions
- :
- Re: dashboard for every row in the table
- Subscribe to RSS Feed
- Mark Topic as New
- Mark Topic as Read
- Float this Topic for Current User
- Bookmark
- Subscribe
- Mute
- Printer Friendly Page
- Mark as New
- Bookmark
- Subscribe
- Mute
- Subscribe to RSS Feed
- Permalink
- Report Inappropriate Content
dashboard for every row in the table
I have got few row of a table, and I wont associate every row with a dasboard.

In this example: dasboard show value of five row of the table.
the property Definition is equal red_economico.
How is this possible utilize 8 dashboard , each for every row ?
The value red_economico can be indexed, as if it were a array ?
red_economico(1) or red_economico(2) .....red_economico(n)
Thank you.
- « Previous Replies
-
- 1
- 2
- Next Replies »
- Mark as New
- Bookmark
- Subscribe
- Mute
- Subscribe to RSS Feed
- Permalink
- Report Inappropriate Content
Hi
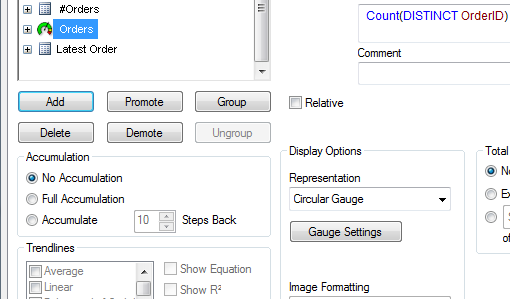
Yes, this is in a table. The dashboard or Gauge is an expression in the table. Conffiguration of this is done on the Expression tab under Display options. Once you have set the Expression then you alter the Display option to Circular Gauge. To set the segments and other settings of the Gauge then click on the Gauge Settings button.
- Mark as New
- Bookmark
- Subscribe
- Mute
- Subscribe to RSS Feed
- Permalink
- Report Inappropriate Content
Hi, Nils Morris
I have finally realized,
It is part of an object of type graph.
Let's see how to do it, So that others can understand
I'm Sorry ,I have the italian version of qlikview.
At the start
| Header 1 |
|---|
| new object |

I need to create a graph ,
And than I chose linear table with option.

Now Add the fields in the table

And then I add the circular gauge in this way, for a field in the table that I want to become a circular gauge.

|
(CHOOSE OF THE LISTBOX)
|
(HEADER OF THE BUTTON)
Also add the minimum and maximum values of the circular gauge, with button called Gauge settings

At the end I will have

- « Previous Replies
-
- 1
- 2
- Next Replies »