Unlock a world of possibilities! Login now and discover the exclusive benefits awaiting you.
- Qlik Community
- :
- Discover
- :
- Programs
- :
- Education
- :
- Qlik Education Discussions
- :
- Re: help on Dynamic X axis for Trellis chart
- Subscribe to RSS Feed
- Mark Topic as New
- Mark Topic as Read
- Float this Topic for Current User
- Bookmark
- Subscribe
- Mute
- Printer Friendly Page
- Mark as New
- Bookmark
- Subscribe
- Mute
- Subscribe to RSS Feed
- Permalink
- Report Inappropriate Content
help on Dynamic X axis for Trellis chart
Hi All,
Please help me if you know the resoulton of this
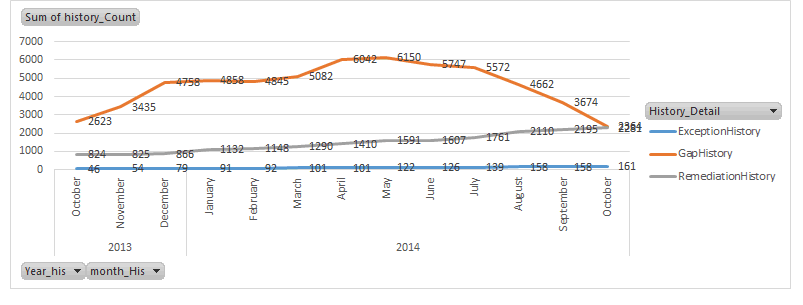
I have to display last 12 month values in the chart. for now it is last 3 months of 2013 and 9 months of 2014
When I use trellis in the chart , X axis is displaying for all months. Please find below attachments .
In this i do not want to show jan to Sep months for 2013.
I want chart to be like Trellis1 from below attachment instead of Teellis
- Mark as New
- Bookmark
- Subscribe
- Mute
- Subscribe to RSS Feed
- Permalink
- Report Inappropriate Content
Hi,
Problem could be with the calender. If you just show months, it could be any year. Try to create a Month Year(e.g.Mar-14,Apr-14) and apply to the chart.
thanx
Senarath
- Mark as New
- Bookmark
- Subscribe
- Mute
- Subscribe to RSS Feed
- Permalink
- Report Inappropriate Content
Thanks for the response.
Data is coming directly coming from data base where Month is hard coded. Not from Calender
Data base Query is having data like below.
| history_Count | month_His | Year_his |
| 2364 | October | 2014 |
| 3674 | September | 2014 |
| 4662 | August | 2014 |
| 5572 | July | 2014 |
| 5747 | June | 2014 |
| 6150 | May | 2014 |
| 6048 | April | 2014 |
| 5082 | March | 2014 |
| 4845 | February | 2014 |
| 4860 | January | 2014 |
| 4868 | December | 2013 |
| 3435 | November | 2013 |
- Mark as New
- Bookmark
- Subscribe
- Mute
- Subscribe to RSS Feed
- Permalink
- Report Inappropriate Content
Hi,
At the script create e month year like
Left(month_His,3)&'-'&Right(Year_his,2) as Month_Year.
thanx
- Mark as New
- Bookmark
- Subscribe
- Mute
- Subscribe to RSS Feed
- Permalink
- Report Inappropriate Content
Thanks for the script. Now i can show to my client that this is possible. Can you please confirm me that the above requirement is not possible in qlikview like Dynamic X - axis and hide if no data