Unlock a world of possibilities! Login now and discover the exclusive benefits awaiting you.
- Qlik Community
- :
- Discover
- :
- Programs
- :
- Education
- :
- Qlik Education Discussions
- :
- Re: question about chart colours
- Subscribe to RSS Feed
- Mark Topic as New
- Mark Topic as Read
- Float this Topic for Current User
- Bookmark
- Subscribe
- Mute
- Printer Friendly Page
- Mark as New
- Bookmark
- Subscribe
- Mute
- Subscribe to RSS Feed
- Permalink
- Report Inappropriate Content
question about chart colours
Hi,
Is it possible to change chart colours by clicking on a bar inside a graph?
Please see my question in detail in the file attached.
Thank you in advance,
Larisa Filonova
Accepted Solutions
- Mark as New
- Bookmark
- Subscribe
- Mute
- Subscribe to RSS Feed
- Permalink
- Report Inappropriate Content
Holding Control Key .
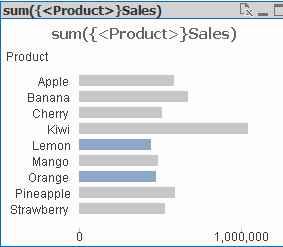
Point to Lemon bar -click with left mouse button
go to Orange bar-click with left mouse button
release control Key
- Mark as New
- Bookmark
- Subscribe
- Mute
- Subscribe to RSS Feed
- Permalink
- Report Inappropriate Content
Hi Larisa,
Yes - if you ensure that your expressions include the state {1} so that no selections affect the chart, then you can alter the 'background color' expression within your overall expression. If you type in:
if([Your Field] = [Your Field]
, ”
, RGB(200,200,200)
)
RGB() you can replace with whatever colour you want the "non-selected" values to be. The colour they'll show will then be the colour each bar was before - so you can use persistent colours or whichever desired colour you want.
It'll claim the syntax is wrong, but it works!
- Mark as New
- Bookmark
- Subscribe
- Mute
- Subscribe to RSS Feed
- Permalink
- Report Inappropriate Content
Yes, it's possible. See attached example.
talk is cheap, supply exceeds demand
- Mark as New
- Bookmark
- Subscribe
- Mute
- Subscribe to RSS Feed
- Permalink
- Report Inappropriate Content
I'd like to make a selection of several bars (e.g. Lemon and Cherry) by clicking on bars without using a list box.
I tried to select a second bar using Ctrl or Shift button. Neither of them works. How is it possible?
- Mark as New
- Bookmark
- Subscribe
- Mute
- Subscribe to RSS Feed
- Permalink
- Report Inappropriate Content
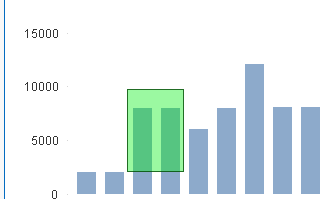
To select more than one bar
Hold left mouse button and highlight two or more bars
- Mark as New
- Bookmark
- Subscribe
- Mute
- Subscribe to RSS Feed
- Permalink
- Report Inappropriate Content
But in this case you select only those bars that are next to each other.
How can I select the first and the fifth bar for instance?
- Mark as New
- Bookmark
- Subscribe
- Mute
- Subscribe to RSS Feed
- Permalink
- Report Inappropriate Content
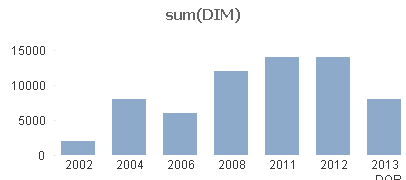
Hold CTRL and then click with left mouse button the bars you want to be shown and release CTRL
All bars

Selected:
- Mark as New
- Bookmark
- Subscribe
- Mute
- Subscribe to RSS Feed
- Permalink
- Report Inappropriate Content
Hi
I don't quite see what you mean.
Please see the file attached. For instance, I have selected the lemon bar, then I want to select the orange bar. If I click on the bar with the left muse button (plus Ctrl), then a menu appears but the orange bar isn't selected.
How can I select both lemon and orange bar?
Thank you in advance,
Larisa Filonova
.bmp)
- Mark as New
- Bookmark
- Subscribe
- Mute
- Subscribe to RSS Feed
- Permalink
- Report Inappropriate Content
Holding Control Key .
Point to Lemon bar -click with left mouse button
go to Orange bar-click with left mouse button
release control Key