Unlock a world of possibilities! Login now and discover the exclusive benefits awaiting you.
- Qlik Community
- :
- All Forums
- :
- GeoAnalytics
- :
- Re: How to add additional columns in QlikView
- Subscribe to RSS Feed
- Mark Topic as New
- Mark Topic as Read
- Float this Topic for Current User
- Bookmark
- Subscribe
- Mute
- Printer Friendly Page
- Mark as New
- Bookmark
- Subscribe
- Mute
- Subscribe to RSS Feed
- Permalink
- Report Inappropriate Content
How to add additional columns in QlikView
How can i add the additional column Rank and add the ranking logic in Qlikview.
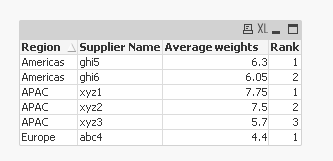
i have a table as below with (Region ,Supplier Name & Average weights) , I need to rank the suppliers region wise .So based on average weight, i rank a supplier only specific to that region . So every region would have its separate ranking based on weights.
| Region | Supplier Name | Average weights (Weight*KPI's) | Rank region wise |
| APAC | xyz1 | 7.75 | 1 |
| APAC | xyz2 | 7.5 | 2 |
| APAC | xyz3 | 5.7 | 3 |
| Europe | abc4 | 4.4 | 1 |
| Americas | ghi5 | 6.3 | 1 |
| Americas | ghi6 | 6.05 | 2 |
- « Previous Replies
-
- 1
- 2
- Next Replies »
Accepted Solutions
- Mark as New
- Bookmark
- Subscribe
- Mute
- Subscribe to RSS Feed
- Permalink
- Report Inappropriate Content
You can look into partial reload for archiving within QlikView. Although it is possible to do partial reload on servers, it would require some configurations which I am not full sure about. The idea behind partial reload is that, you just reload the new data while still keeping the existing data. This fits your need, but like I said, can be complicated.
On the other hand, you don't have to keep a single file for each day. You can timestamp your data and save them all in one single qvd. The process is called incremental reload and you will find 100 of discussions and blogs on this topic
- Mark as New
- Bookmark
- Subscribe
- Mute
- Subscribe to RSS Feed
- Permalink
- Report Inappropriate Content
May be like this
Table:
LOAD * INLINE [
Region, Supplier Name, Average weights
APAC, xyz1, 7.75
APAC, xyz2, 7.5
APAC, xyz3, 5.7
Europe, abc4, 4.4
Americas, ghi5, 6.3
Americas, ghi6, 6.05
];
FinalTable:
LOAD *,
If(Region = Previous(Region), RangeSum(Peek('Rank'), 1), 1) as Rank
Resident Table
Order By Region, [Average weights] desc;
DROP Table Table;
- Mark as New
- Bookmark
- Subscribe
- Mute
- Subscribe to RSS Feed
- Permalink
- Report Inappropriate Content
Thanks Sunny this works.
I am new to QlikView . So ,One question ,how can i do multiplication between columns
Example : My Average weight is multiplication of (KPI * Weight %) , So my rank and Average weights is the output columns.
| Region | Supplier Name | KPI | Weight % | Average weights (KPI *Weight%) | Rank region wise |
| APAC | xyz1 | 100 | 10% | 7.75 | 1 |
| APAC | xyz2 | 100 | 5% | 7.5 | 2 |
| APAC | xyz3 | 100 | 10% | 5.7 | 3 |
| Europe | abc4 | 80 | 7% | 4.4 | 1 |
| Americas | ghi5 | 100 | 10% | 6.3 | 1 |
| Americas | ghi6 | 100 | 10% | 6.05 | 2 |
- Mark as New
- Bookmark
- Subscribe
- Mute
- Subscribe to RSS Feed
- Permalink
- Report Inappropriate Content
How do you get 7.75 by multiplying 100 with 10%?
- Mark as New
- Bookmark
- Subscribe
- Mute
- Subscribe to RSS Feed
- Permalink
- Report Inappropriate Content
Just an example ..ignore 7.75 ..the number to be populated in average weight should be %weight*KPI and then be ranked.
- Mark as New
- Bookmark
- Subscribe
- Mute
- Subscribe to RSS Feed
- Permalink
- Report Inappropriate Content
May be this
Table:
LOAD *,
KPI * [Weight %] as [Average weights];
LOAD * INLINE [
Region, Supplier Name, KPI, Weight %
APAC, xyz1, 100, 10%
APAC, xyz2, 100, 5%
APAC, xyz3, 100, 10%
Europe, abc4, 80, 7%
Americas, ghi5, 100, 10%
Americas, ghi6, 100, 10%
];
FinalTable:
LOAD *,
If(Region = Previous(Region), RangeSum(Peek('Rank'), 1), 1) as Rank
Resident Table
Order By Region, [Average weights] desc;
DROP Table Table;
- Mark as New
- Bookmark
- Subscribe
- Mute
- Subscribe to RSS Feed
- Permalink
- Report Inappropriate Content
Thanks this work.
I am using a excel sheet to import Region, Supplier name, KPI and Weight % in my table . I have to create this table every month which can have additional suppliers names and different Weight % .
How can i keep my previous month table data every month and go on adding new table with new details (new supplier name , weight %)
So that i can compare every month the supplier rankings ?
- Mark as New
- Bookmark
- Subscribe
- Mute
- Subscribe to RSS Feed
- Permalink
- Report Inappropriate Content
Create multiple qvds for each day and timestamp them so that you can compare days
- Mark as New
- Bookmark
- Subscribe
- Mute
- Subscribe to RSS Feed
- Permalink
- Report Inappropriate Content
Didn't get you .. may i elaborate more..
I am currently doing a set of calculations to arrive on a final table (Table 1)
Table 1 is created on month 1 to arrive on supplier rank 1 .
Now , i have to use the same script as i used for creating table 1 to create table 2 for month 2 and arrive on rank 2 for second month .
Every month , Table 2 data get added to Table 1 to create a archive table and new data get loaded in Table 2 .
and i have to compare the data of current and previous ranks .
| Month 1 | Month 2 | Month 3 | Month 4 | |
| Current Data Table | Table 1 | Table 2 | Table 3 | Table 4 |
| Archive Table | Table 1+Table 2 | Table 1+Table 2+Table 3 | ||
| Output column (Supplier Rank) | Rank 1 | Rank 2 | Rank 3 | Rank 4 |
| Compare Rank | Rank 2 vs Rank1 | Rank 1 vs Rank 2 vs Rank 3 | Rank 1 vs Rank 2 vs Rank 3 vs Rank 4 |
I don't want to maintain archive qvd's to upload every month for comparison . Is it possible to keep a table where
i can append data month on month and when comparison is required is can compare any month rank.
- Mark as New
- Bookmark
- Subscribe
- Mute
- Subscribe to RSS Feed
- Permalink
- Report Inappropriate Content
When you reload your application, it reloads all the data (unless you are doing a partial reload). So, I am not sure how you plan to apend data month on month? Or may be I am still not sure what you are looking to get.... Taking a step back, this is table with the rank is needed in the script or you are looking to create this on the front end?
- « Previous Replies
-
- 1
- 2
- Next Replies »