Unlock a world of possibilities! Login now and discover the exclusive benefits awaiting you.
- Qlik Community
- :
- All Forums
- :
- GeoAnalytics
- :
- Remove/Edit Tooltip values in Map chart type when ...
- Subscribe to RSS Feed
- Mark Topic as New
- Mark Topic as Read
- Float this Topic for Current User
- Bookmark
- Subscribe
- Mute
- Printer Friendly Page
- Mark as New
- Bookmark
- Subscribe
- Mute
- Subscribe to RSS Feed
- Permalink
- Report Inappropriate Content
Remove/Edit Tooltip values in Map chart type when map point is hovered upon in Qliksense.
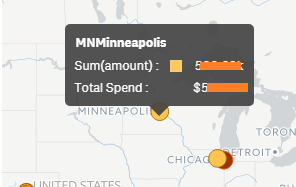
I am unable to edit / remove these tool tip values. First one is when I color by Measure and the second is the Measure value. I haven't used any extensions. I've tried as much as I can (to remove the measure or to color automatically) but I am unable to get around it. Any help is appreciated.
TIA
- Mark as New
- Bookmark
- Subscribe
- Mute
- Subscribe to RSS Feed
- Permalink
- Report Inappropriate Content
Hi TIA,
Have you tried formating the bubble label as "custom"? In there, you can specify exactly what should appear.
I hope this helps. If not, let me know and I can try again to help.
Best regards,
Pam
- Mark as New
- Bookmark
- Subscribe
- Mute
- Subscribe to RSS Feed
- Permalink
- Report Inappropriate Content
Hello Pamela,
Thank you for your help. I do not see any such option on my Chart Properties (on the right pane). Are you using an extension? Also, would you please show me your tooltip pointing to one of the city/postal code like my tooltip in the Question.
TIA.
- Mark as New
- Bookmark
- Subscribe
- Mute
- Subscribe to RSS Feed
- Permalink
- Report Inappropriate Content
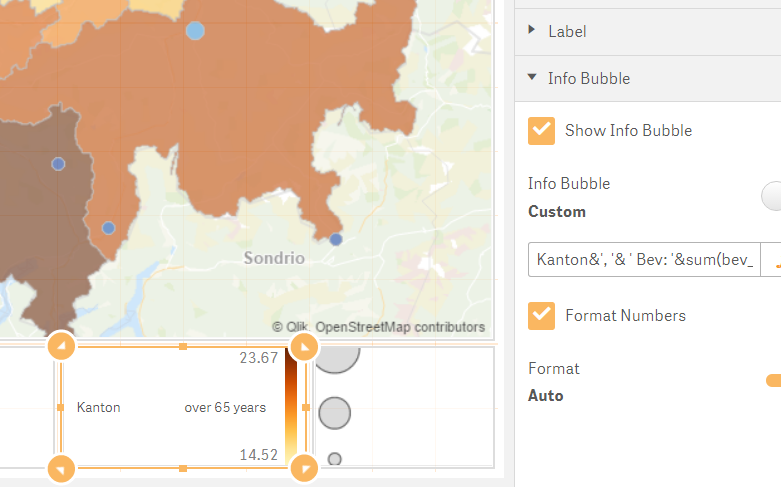
Hi TIA,
I am not using an extension. I am using a bubble layer (for cities) and an area layer (for states). The "Presentation" panel is sometimes hard to find. If you mouse to the right and all the way down, you'll see when it turns into a pointing finger. Sometimes the panel is not visible until you have clicked on it once aleady. Inside the "Presenation" panel, there are different panels for example legend, color, etc, you want to select the one "Info Bubble" (I am working on a German version of Sense and I am imagining what the English names would be. In my shot, it is called "Darstellung"). Info Bubble is the one furthest down.
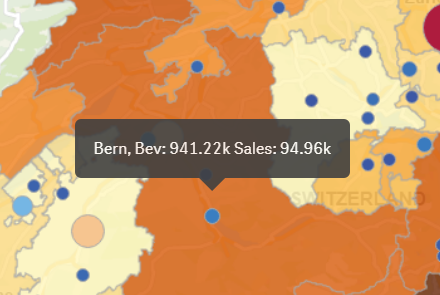
I'm also attaching a shot of my mouse hovering over a state - you can see the info bubble shows state name, population and sales. You can format the information how you like in the formula.
I hope this helps,
Pam
- Mark as New
- Bookmark
- Subscribe
- Mute
- Subscribe to RSS Feed
- Permalink
- Report Inappropriate Content
Hi Pamela,
Thanks again for helping out. But the US / English version (Sept 2017) of Qliksense doesn't have such drop down or option under Appearance or Presentation Layer or any other properties mentioned in the attachment. Further, I have looked for the hidden properties all the way at the bottom but there was none. PFA below.

- Mark as New
- Bookmark
- Subscribe
- Mute
- Subscribe to RSS Feed
- Permalink
- Report Inappropriate Content
Hi Manan,
The map that used by Pamela was GeoAnalytics' map layer, which was probably not the same as the map that you used in your app.
To answer your question, there is no "Bubble Layer" for Qlik Sense' own map chart 
- Mark as New
- Bookmark
- Subscribe
- Mute
- Subscribe to RSS Feed
- Permalink
- Report Inappropriate Content
May be this helps:
- Mark as New
- Bookmark
- Subscribe
- Mute
- Subscribe to RSS Feed
- Permalink
- Report Inappropriate Content
This one too: