Unlock a world of possibilities! Login now and discover the exclusive benefits awaiting you.
- Qlik Community
- :
- Forums
- :
- Groups
- :
- Industry and Topics
- :
- Healthcare
- :
- Visualizing Length of Stay
- Subscribe to RSS Feed
- Mark Topic as New
- Mark Topic as Read
- Float this Topic for Current User
- Bookmark
- Subscribe
- Mute
- Printer Friendly Page
- Feature this Topic
- Mark as New
- Bookmark
- Subscribe
- Mute
- Subscribe to RSS Feed
- Permalink
- Report Inappropriate Content
Visualizing Length of Stay
What do the numbers 3.53, 17.6 and 4 all have in common?
They are completely useless when displayed by themselves because have no context.
Length of Stay is a vastly important metric in health care and here is the most common way to display it:

Perhaps you can make it prettier using a gauge, an LED, some giant sized font or some really out of this world java extension but will that really change the fact that it’s basically a meaningless number without context?
So often in the health care field we are so starved for data we can’t wait to slap the values on the screen and then start slicing it and dicing it before really thinking through the more basic question “What value does the number have?” Prettier isn’t better … it’s just prettier.
Average LOS is a real number that truly represents our average LOS. But does average length of stay truly represent how well we are doing? Is it fair to compare our average length of stay to anyone else? Is it even fair to compare the average length of stay within our organization between time periods? What about comparing the average length of stay between specialties?
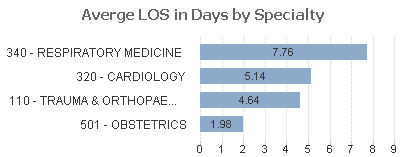
I submit that any comparison of the average length of stay is like comparing the size of pizzas to the size of chocolates. One is much bigger than the other but who cares … we expect it to be. Just like we would expect the average length of stay for obstetrics patients to be less than the average length of stay for cardiology patients.
But LOS is important and the purpose of analytics is to measure where we are and help us find areas that need improving so comparisons are only natural. So how can we go about visualizing the length of stay in a meaningful way that doesn’t involve comparing pizza sizes to chocolate sizes?
Click here to read my entire post on my website QlikDork.com