Unlock a world of possibilities! Login now and discover the exclusive benefits awaiting you.
Announcements
Now accepting applications for the Qlik Luminary and Partner Ambassador Programs: Apply by July 6!
- Qlik Community
- :
- Discover
- :
- Programs
- :
- Learning
- :
- Qlik Learning Discussions
- :
- Aggregation Distinct
Options
- Subscribe to RSS Feed
- Mark Topic as New
- Mark Topic as Read
- Float this Topic for Current User
- Bookmark
- Subscribe
- Mute
- Printer Friendly Page
Turn on suggestions
Auto-suggest helps you quickly narrow down your search results by suggesting possible matches as you type.
Showing results for
Not applicable
2014-10-07
11:48 PM
- Mark as New
- Bookmark
- Subscribe
- Mute
- Subscribe to RSS Feed
- Permalink
- Report Inappropriate Content
Aggregation Distinct
Hello,
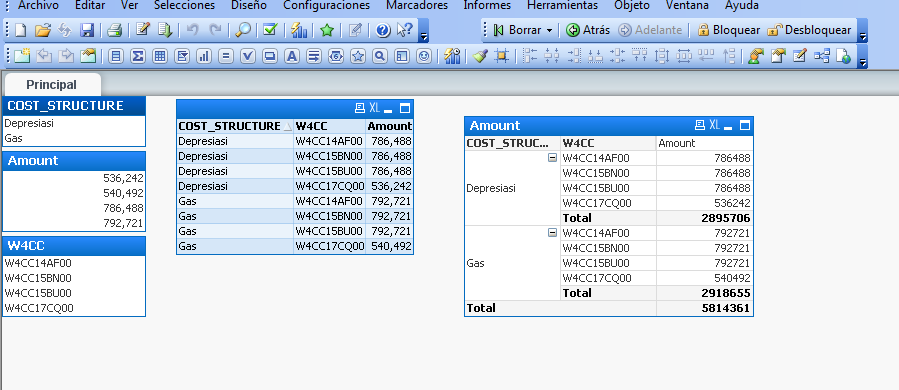
I have this sample data.
| COST_STRUCTURE | Amount | W4CC |
| Gas | 792,721 | W4CC14AF00 |
| Gas | 792,721 | W4CC15BN00 |
| Gas | 792,721 | W4CC15BU00 |
| Depresiasi | 786,488 | W4CC14AF00 |
| Depresiasi | 786,488 | W4CC15BN00 |
| Depresiasi | 786,488 | W4CC15BU00 |
| Gas | 540,492 | W4CC17CQ00 |
| Gas | 540,492 | W4CC17CQ00 |
| Gas | 540,492 | W4CC17CQ00 |
| Depresiasi | 536,242 | W4CC17CQ00 |
| Depresiasi | 536,242 | W4CC17CQ00 |
| Depresiasi | 536,242 | W4CC17CQ00 |
So I want to create a chart to know how much di Sum(Distinct Amount) per W4CC, but the Dimension is COST_STRUCTURE.
More or less, the chart will be like this :
| Cost Structure | Total Amount |
| Gas | 2,918,655 |
| Depresiasi | 2,895,706 |
Gas is From Amount W4CC15BU00 + W4CC14AF00 + W4CC15BN00 + W4CC17CQ00, but all of them is distinct by W4CC.
Please help!
Thanks
Regards,
Paulus Indra Salim.
972 Views
1 Reply
Master II
2014-10-08
12:16 AM
- Mark as New
- Bookmark
- Subscribe
- Mute
- Subscribe to RSS Feed
- Permalink
- Report Inappropriate Content
Is this?
Only you need, in the select put DISTINCT
LOAD distinct
COST_STRUCTURE, Amount, W4CC
FROM
[http://community.qlik.com/thread/136835]
(html, codepage is 1252, embedded labels, table is @1);
816 Views