Unlock a world of possibilities! Login now and discover the exclusive benefits awaiting you.
- Qlik Community
- :
- All Forums
- :
- Qlik NPrinting
- :
- Filter on level with calculated dimension - Nprint...
- Subscribe to RSS Feed
- Mark Topic as New
- Mark Topic as Read
- Float this Topic for Current User
- Bookmark
- Subscribe
- Mute
- Printer Friendly Page
- Mark as New
- Bookmark
- Subscribe
- Mute
- Subscribe to RSS Feed
- Permalink
- Report Inappropriate Content
Filter on level with calculated dimension - Nprinting
Hello community,
I am trying to find a solution about filters on levels in NPrinting.
I explain : I have in QV application a field which allows me to create my TOP 25.
In my NPrinting I want to create a graphic for only this TOP 25 => I want to use it as my level
Actually i didn't find solution to use calculate field as level....I am not sure that it is possible.
If someone has any idea, i take it ! 
Thanks in advance for your help.
Accepted Solutions
- Mark as New
- Bookmark
- Subscribe
- Mute
- Subscribe to RSS Feed
- Permalink
- Report Inappropriate Content
If you look at the release notes for the latest service pack 17.3.1 you see mention trust calculated dimensions are no longer selectable as a level so to meet your requirement you need to have a seperate qv app containing only your top 25. so filter in your load script or in your existing app have a flag that identifies the top 25 that way you can pass the restriction through as a report filter.
- Mark as New
- Bookmark
- Subscribe
- Mute
- Subscribe to RSS Feed
- Permalink
- Report Inappropriate Content
By level do you mean you want to show the first 25 as level one then the next 25 as level 2 etc... In that case I would recommend you look at creating buckets in your QV app to group into levels.
If you just want the top 25 to be displayed then just display the top 25 graphic and you don't need a level. levels are resource intensive so best to try and do the hard work in your QV app.
- Mark as New
- Bookmark
- Subscribe
- Mute
- Subscribe to RSS Feed
- Permalink
- Report Inappropriate Content
Hello Andy,
Thank you for you quick response.
I mean I have my top 25 in my QV application and I want to have 25 graphics for these top.
I don't know if I am clear or not..sorry.
Thanks for your help.
Aina
- Mark as New
- Bookmark
- Subscribe
- Mute
- Subscribe to RSS Feed
- Permalink
- Report Inappropriate Content
No idea ?
- Mark as New
- Bookmark
- Subscribe
- Mute
- Subscribe to RSS Feed
- Permalink
- Report Inappropriate Content
If you look at the release notes for the latest service pack 17.3.1 you see mention trust calculated dimensions are no longer selectable as a level so to meet your requirement you need to have a seperate qv app containing only your top 25. so filter in your load script or in your existing app have a flag that identifies the top 25 that way you can pass the restriction through as a report filter.
- Mark as New
- Bookmark
- Subscribe
- Mute
- Subscribe to RSS Feed
- Permalink
- Report Inappropriate Content
You can just use a dimension limit. This works for me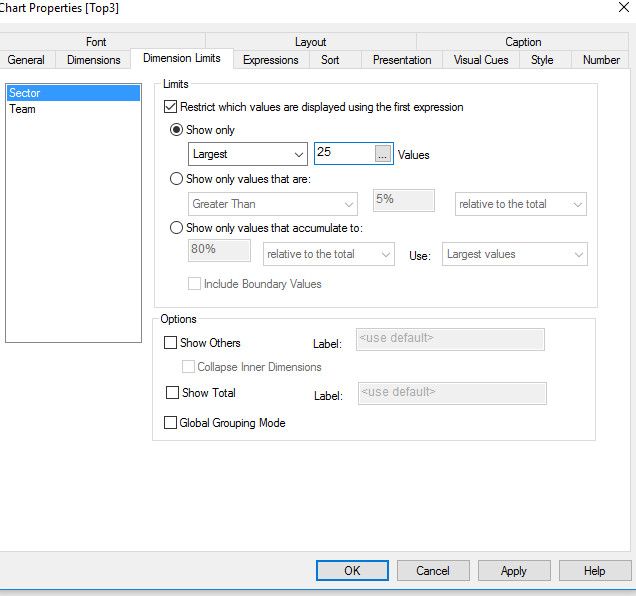
I only see the largest 25 values, without using any filter(s)
- Mark as New
- Bookmark
- Subscribe
- Mute
- Subscribe to RSS Feed
- Permalink
- Report Inappropriate Content
Hello Wouter,
Thanks for your response but my problem is to display theses Top in my NPrinting report.
I don't have issue on my QV application but may be i don't understand your approach 
- Mark as New
- Bookmark
- Subscribe
- Mute
- Subscribe to RSS Feed
- Permalink
- Report Inappropriate Content
If you can solve it QlikView, then you can use your object as well in nprinting.
I created a object Top25 in QlikView.

Then I use it in nprinting:
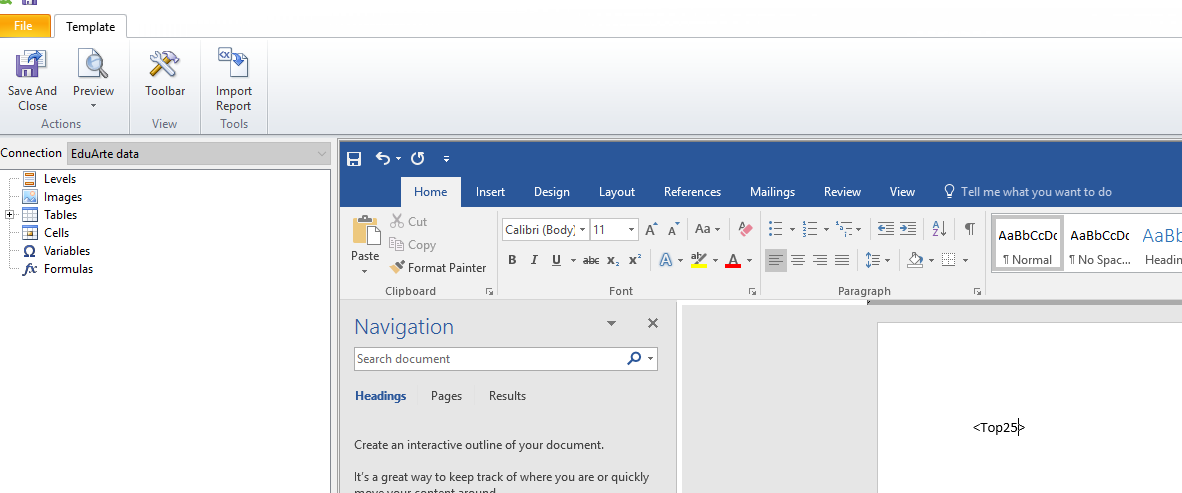
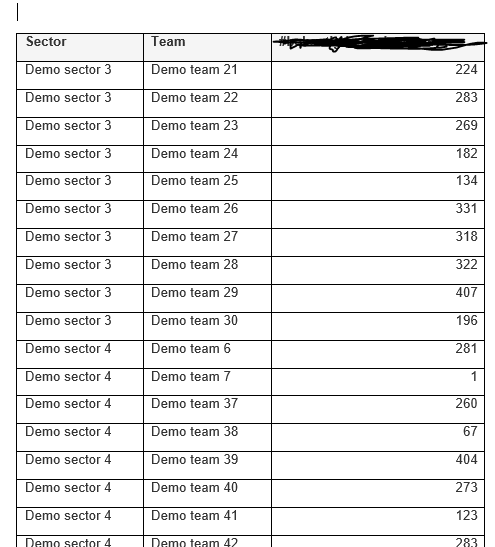
The result is my expect values:
- Mark as New
- Bookmark
- Subscribe
- Mute
- Subscribe to RSS Feed
- Permalink
- Report Inappropriate Content
I can use my object with my TOP 25 values but I need to create graphics for these top 25 so my question was how can i do that because I can't use calculated field as level in NPrinting.
Example I have my top 25 list which is dynamic in Qlikview (of course). In NPrinting I want to have graphic for each value of these TOP 25.
if I have toto, titi, tata I want to have one graphic for toto, one for titi and another one for tata. But if tomorrow I have toto, tutu, tata i will have one graphic for toto, one for tutu and one for tata but no titi anymore.
- Mark as New
- Bookmark
- Subscribe
- Mute
- Subscribe to RSS Feed
- Permalink
- Report Inappropriate Content
Ok. What you can do is what Andy described. Flag you data in your QlikView Script. This flag can be used in nprinting.