Unlock a world of possibilities! Login now and discover the exclusive benefits awaiting you.
- Qlik Community
- :
- All Forums
- :
- Qlik NPrinting
- :
- How to dynamically Update the Nrpinting Report whe...
- Subscribe to RSS Feed
- Mark Topic as New
- Mark Topic as Read
- Float this Topic for Current User
- Bookmark
- Subscribe
- Mute
- Printer Friendly Page
- Mark as New
- Bookmark
- Subscribe
- Mute
- Subscribe to RSS Feed
- Permalink
- Report Inappropriate Content
How to dynamically Update the Nrpinting Report when there is some change made in Qlik Sense App
Hi All,
I have created a Nprinting Pixel Perfect report based on Qlik Sene App. Now when I try to make some changes in the measures in the Qlik Sense App then the Graph which is been used in Nprinting Pixel Perfect Report doesn't automatically update but instead the Graphs Disappears. I am not sure why this is happening?
Can you please tell me what is the approach of Fixing this.
Before Making Changes (Changes in Measure) in Qlik Sense App. This is how the Pixel Perfect Report Looks in Nprinting.

After making changes in Measure in Qlik Sense App. The Graphs in Nprinting Pixel Perfect Report Disappears. So I had to delete these and create it again.

Thanks,
Vivek
- Tags:
- nprintng
- qlik sense
- Mark as New
- Bookmark
- Subscribe
- Mute
- Subscribe to RSS Feed
- Permalink
- Report Inappropriate Content
Building Pixel Perfect reports is a process which needs to be thought through - so jumping between Qlik Sense and NPrinitng without actually validating data prior building report is not an option for me. I would get all data right first in Qlik and after locking it in i would then start building report. There is too much risk that you would have to build everything from scratch that i would not be able to afford constant measure changes.
however...
If you have a master object (measure) in a chart and you just change a master object - measure definition, it should still flow through after change is done and your chart i n pixel perfect should reflect data coming from new definition.
I would obviously refresh metadata and "update" all objects in template after change was done.
regards
Lech
- Mark as New
- Bookmark
- Subscribe
- Mute
- Subscribe to RSS Feed
- Permalink
- Report Inappropriate Content
Nope,
we have created normal tabes and three measure for each table so that by using that table we can create the stacked bar chart in pixel perfect report in NPrinting.
then we got some requirements to do some change in the measure. Then after doing some changes in the measure in the Qlik Sense app then I have updated or reloaded my NPrinting connection metadata so that it will fetch the updated measure from the Qlik Sense. Then after reloading the metadata of connection, I reviewed the
report I found that all the graphs vanished from pixel perfect report that is published in the newsstand.
But still in the NPrinting designer, all the graphs are showing as it was earlier but when we run the report and check it in the newsstand then the report doesn't have any graphs.
- Mark as New
- Bookmark
- Subscribe
- Mute
- Subscribe to RSS Feed
- Permalink
- Report Inappropriate Content
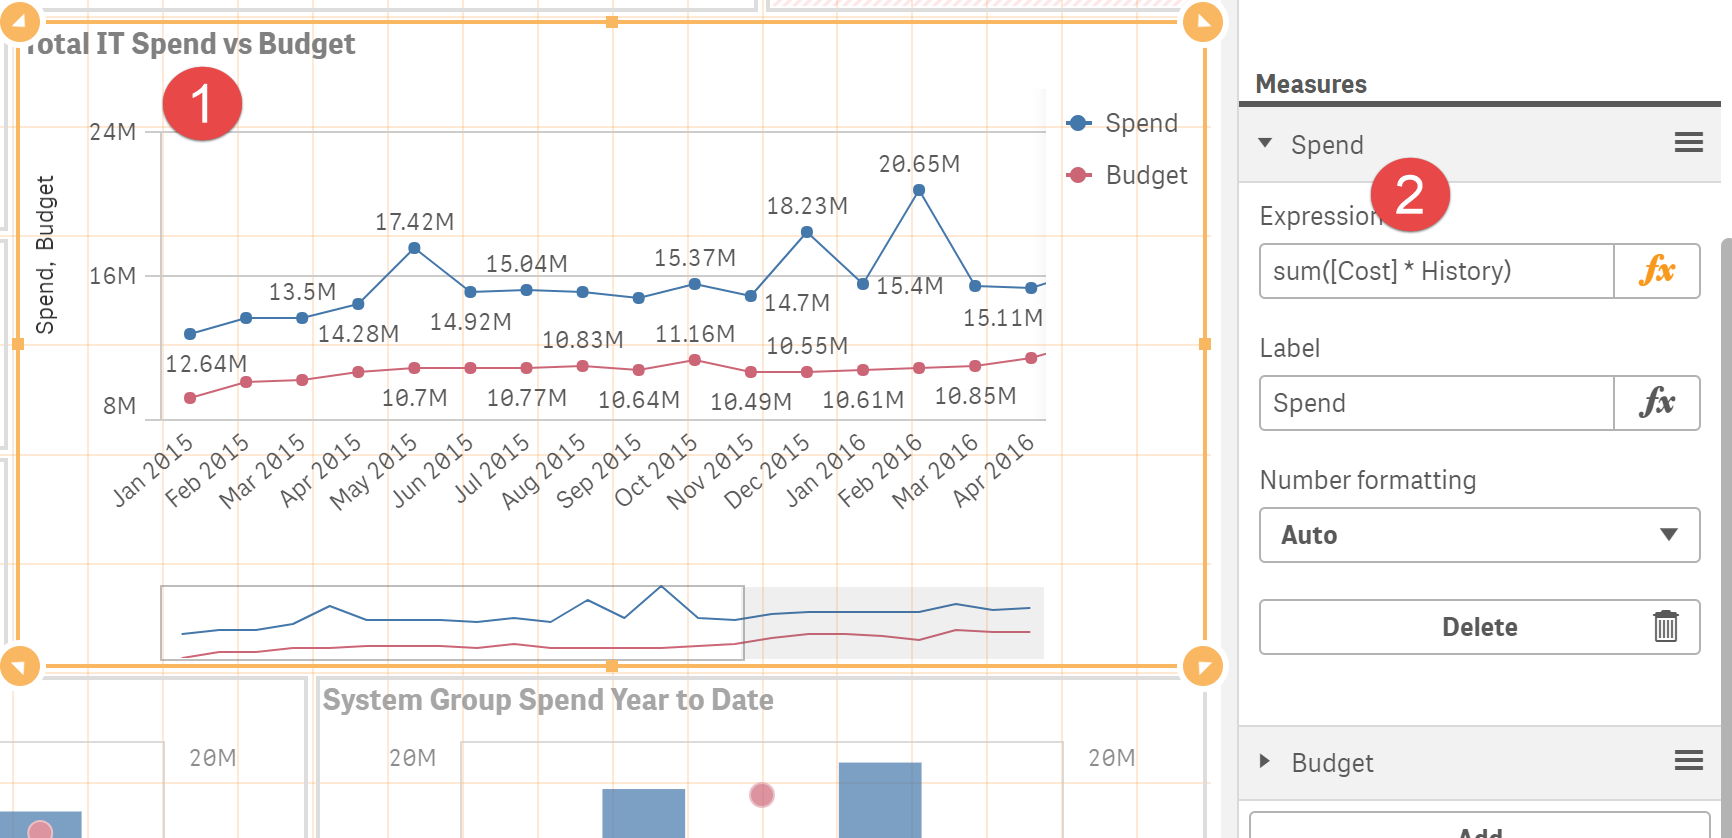
where do you change this measure i n Qlik Sense? Is it master object or you type it in the chart F(X) properties window
- Mark as New
- Bookmark
- Subscribe
- Mute
- Subscribe to RSS Feed
- Permalink
- Report Inappropriate Content
so how can I overcome this problem?
The interesting thing I noticed in NPrinting designer is that whenever after doing some changes in Qlik Sense App and we reloaded the metadata connection
then 2 things happens in backend:-
1. All the graphs retain their dimension values but they lost their measure value.
i.e. the data binding between the graph and dimension still remain same but the binding between the graph and the measure have been broken and it shows the blank value their.
2. The table that we have added for creating a graph in Pixel perfect report does not get updated .
ex:-
last time I have added two filter condition in the measure in Qlik Sense app.
Next time when you added 2 or 3 filter more in the Qlik Sense app then after reloading metadata connection of that Qlik Sense app in the NPrinting designer still show only 2 filters for that table .
i.e.
the table is not updated in NPrinting designer
- Mark as New
- Bookmark
- Subscribe
- Mute
- Subscribe to RSS Feed
- Permalink
- Report Inappropriate Content
so again...
where do you change your measure in Qlik Sense?
- in master objects library?
- directly in the chart?
- Mark as New
- Bookmark
- Subscribe
- Mute
- Subscribe to RSS Feed
- Permalink
- Report Inappropriate Content
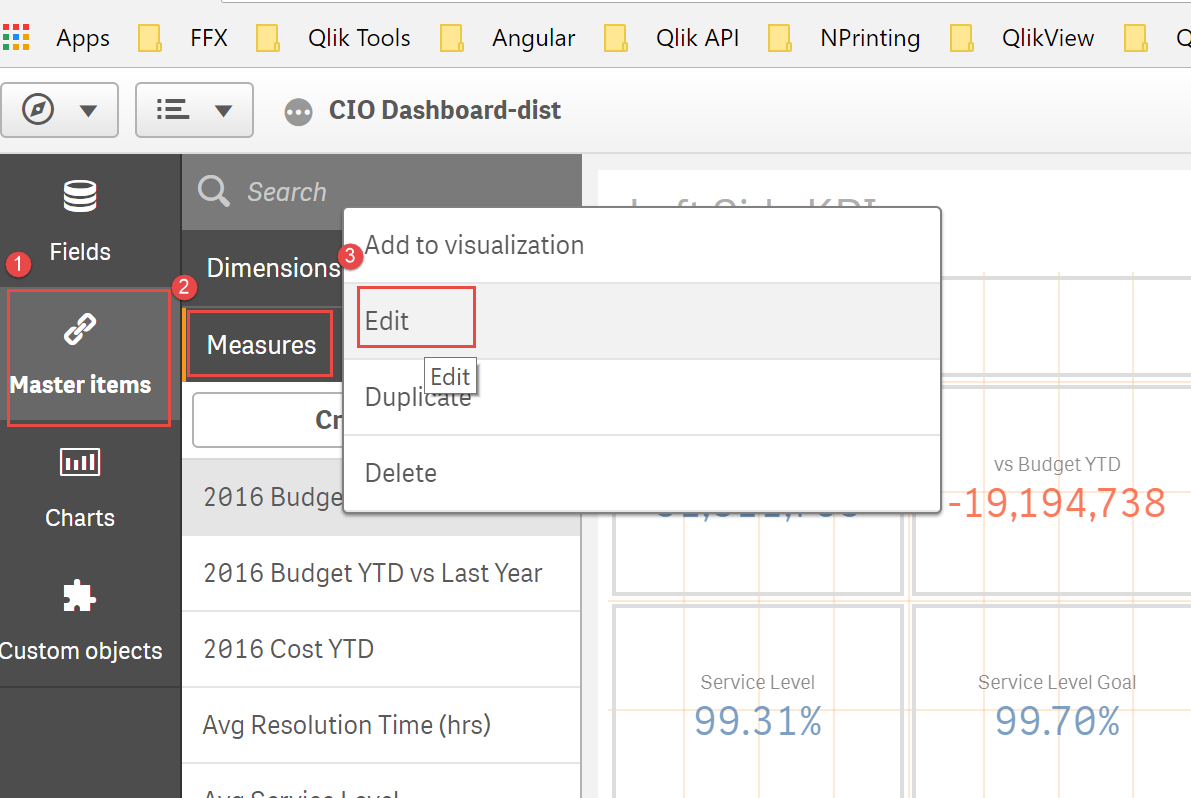
ok, instead of creating normal measure we need to create a master measure .
Then whenever we do some changes in the master measure in Qlik Sense app and after reloading the metadata of the connection in NPrinting. NPrinting pixel perfect report won't get affected and all the graphics will be as it is.
Ok, let me test this in a new blank pixel perfect report.
- Mark as New
- Bookmark
- Subscribe
- Mute
- Subscribe to RSS Feed
- Permalink
- Report Inappropriate Content
I have not said anything yet - i just asked if you use master objects or if you use inline formulas in charts.
There is also another option - QlikSense variables as expressions which i am in favour!
- Mark as New
- Bookmark
- Subscribe
- Mute
- Subscribe to RSS Feed
- Permalink
- Report Inappropriate Content
No, I'm creating graphs by using table .
First I have added a table from Qlik Sense App in the NPrinting
Then I'm using that table for creating graphs in pixel prefect report
- Mark as New
- Bookmark
- Subscribe
- Mute
- Subscribe to RSS Feed
- Permalink
- Report Inappropriate Content
Table is created in the Qlik Sense app where table have one dimension and 3 measure.
Where dimension and measures are normal not master one.