Unlock a world of possibilities! Login now and discover the exclusive benefits awaiting you.
- Qlik Community
- :
- All Forums
- :
- Qlik NPrinting
- :
- Nprinting Optimization
- Subscribe to RSS Feed
- Mark Topic as New
- Mark Topic as Read
- Float this Topic for Current User
- Bookmark
- Subscribe
- Mute
- Printer Friendly Page
- Mark as New
- Bookmark
- Subscribe
- Mute
- Subscribe to RSS Feed
- Permalink
- Report Inappropriate Content
Nprinting Optimization
Hi Guys,
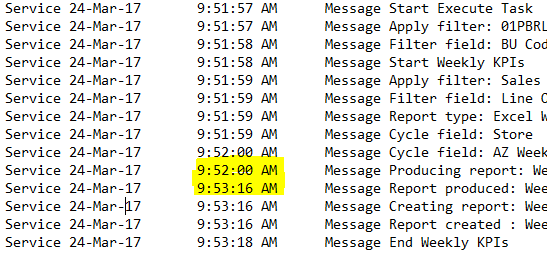
I have the below Nprinting Log about my nprinting schedule job that has around 600 excel reports(filter) to generate.
As you can see in the screen below that every single report is taking around 1 minute to be produced.(highlighted in yellow)
I was running the same schedule from several months and the Report was produced in around 25 seconds.
What should i change from my side to make the Report Producing faster.
- Mark as New
- Bookmark
- Subscribe
- Mute
- Subscribe to RSS Feed
- Permalink
- Report Inappropriate Content
I think that the amount of data in your Qlik app is also larger then it was a few months ago. More data will slowdown the speed of creating your reports. You can speed up your reports if you can work with aggregated data instead of all details. For example: Aggregate your data by week
- Mark as New
- Bookmark
- Subscribe
- Mute
- Subscribe to RSS Feed
- Permalink
- Report Inappropriate Content
Thanks for your reply but the size of the files is still the same about 450 KB.
Our report is taking specific dates and specific criteria so the data is not accumulating from month to month.
- Mark as New
- Bookmark
- Subscribe
- Mute
- Subscribe to RSS Feed
- Permalink
- Report Inappropriate Content
hi,
more important is the amount of data in Qlik. Not your final document. Nprinting must filter throug all the data.
Besides Qlik are there many other things. How busy is your Qlik server and your nprinting server.
You can creatie a Qlik document with only the data and objects for nprinting. This will speed up your process.
- Mark as New
- Bookmark
- Subscribe
- Mute
- Subscribe to RSS Feed
- Permalink
- Report Inappropriate Content
HI Elie
I had similar issues. There are a few things to check.
1. Data - This is before the App showed 1 month of data now it shows 12, or before it was aggregated now its showing individual rows
2. Increase of Sheets - Maybe before you only were populating 4 Sheets now there's 8 sheets
3. Increase of data on each sheet - Maybe before you had 1 chart now you have 3 charts in a Excel sheet
4. Aggr done in Excel - This is where you are doing a resource heavy Template in Excel (i.e sums etc)
5. Bandwidth - If you find everything else to go okay remember these need to be emailed so if your bandwidth decreases this will slow the distribution
The above affected me when i was developing so i thought i would share.