Unlock a world of possibilities! Login now and discover the exclusive benefits awaiting you.
- Qlik Community
- :
- All Forums
- :
- Qlik NPrinting
- :
- Re: Nprinting Pivot table presentation
- Subscribe to RSS Feed
- Mark Topic as New
- Mark Topic as Read
- Float this Topic for Current User
- Bookmark
- Subscribe
- Mute
- Printer Friendly Page
- Mark as New
- Bookmark
- Subscribe
- Mute
- Subscribe to RSS Feed
- Permalink
- Report Inappropriate Content
Nprinting Pivot table presentation
Hi There,
I am using a nprinting june 2018 and trying to insert a pivot table.
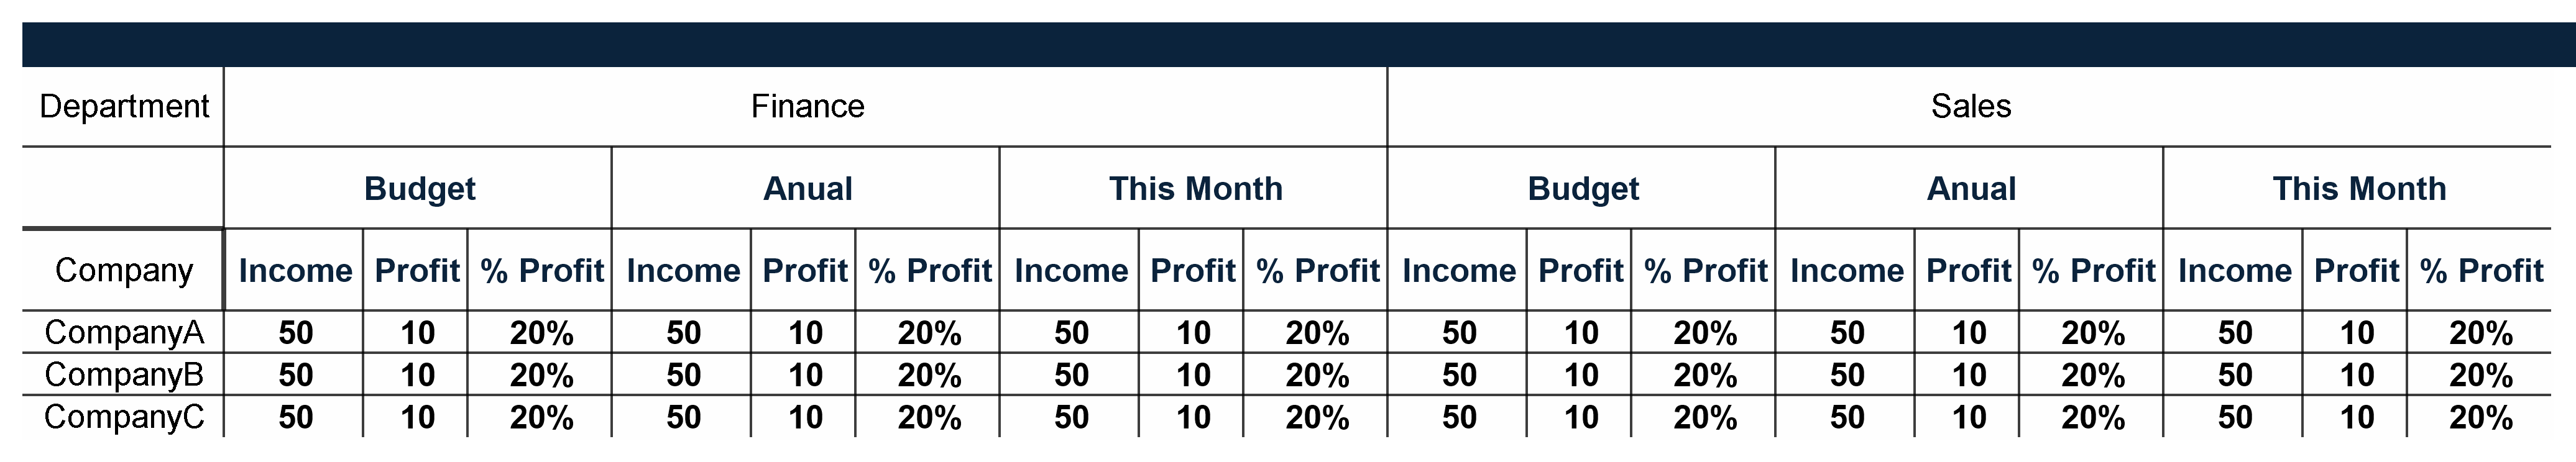
I wants the pivot to looks like the picture, it does in qlikview
but when inserting to nprint the dimension repeat each time like (attached in word). The dimension repeats itself
I tried addvalue function, pick function and editing the script so it will come as strait dimension -
They all works in qlikview but not in nprinting. Any Ideas?
- « Previous Replies
-
- 1
- 2
- Next Replies »
Accepted Solutions
- Mark as New
- Bookmark
- Subscribe
- Mute
- Subscribe to RSS Feed
- Permalink
- Report Inappropriate Content
no,
what i meant was to create straight table with constant number of columns and set analysis to calculate required expressions
.So,
I do not see it working if you have variable number of departments. On the other hand if there is always the same number of departments, you could create a straight table with measures using set analysis for each department/period-type.
I know it will be more work, but at least you could create those required groupings.
In other words: column headers would always be static and would be build directly in PPT template, and only values would be populated directly from Qlik
- Mark as New
- Bookmark
- Subscribe
- Mute
- Subscribe to RSS Feed
- Permalink
- Report Inappropriate Content
- Mark as New
- Bookmark
- Subscribe
- Mute
- Subscribe to RSS Feed
- Permalink
- Report Inappropriate Content
I suggest that you do the following in order that we can better understand your requirement:
Create a sample QVW or use the attached Qlik salesdemo.qvw.
To illustrate your requirement:
- Create a NP report template and show us an image snapshot of the template
- Preview the report
- What are your expected results? Show us an image
- What are your actual results? Show us an image
This will better help us to understand what you are trying to accomplish to meet your requirement so a solution might be provided in this forum.
Thank you.
- Mark as New
- Bookmark
- Subscribe
- Mute
- Subscribe to RSS Feed
- Permalink
- Report Inappropriate Content
agree with Frank,
also. Is your intend to use image of your QlikView object or row data. If you want to use row data (from your QlikView Pivot Table) i have a bad news - it will repeat value on each row - this is how it is - end of story.
There are workarounds for it, but they will depend on how you want your final report to look like. If it has only few columns - you may be able to mimick pivot view using set analysis and make fonts and background in the same colour to imitate Pivot Table view...
I will not elaborate on it more, as we need first your detailed input as @Frank_S mentioned.
cheers
- Mark as New
- Bookmark
- Subscribe
- Mute
- Subscribe to RSS Feed
- Permalink
- Report Inappropriate Content
Hi,
I attach the desired pivot
Regards,
- Mark as New
- Bookmark
- Subscribe
- Mute
- Subscribe to RSS Feed
- Permalink
- Report Inappropriate Content
Hi,
Thanks for the explanations.
Attach the qvw with the desired pivot table (as in the png pivot_qvw)
The attached power point is how it looks in the nprinting when i attach as a table to npritning.
The only problem that it say 9 times Sales and 9 time Finance
It also reverse the table to the right side but this is good for me.
Hope it is now better understood.
Cheers,
Limor
- Mark as New
- Bookmark
- Subscribe
- Mute
- Subscribe to RSS Feed
- Permalink
- Report Inappropriate Content
- Mark as New
- Bookmark
- Subscribe
- Mute
- Subscribe to RSS Feed
- Permalink
- Report Inappropriate Content
The presentation
- Mark as New
- Bookmark
- Subscribe
- Mute
- Subscribe to RSS Feed
- Permalink
- Report Inappropriate Content
You mean by mimick is adding a table by pixel perfect report?
I have one pivot with 5 rows. i couldn't find the workarounds. do you mean to add a table
and than the headers will be the columns from pivot table?
Cheers,
Limor
- Mark as New
- Bookmark
- Subscribe
- Mute
- Subscribe to RSS Feed
- Permalink
- Report Inappropriate Content
no,
what i meant was to create straight table with constant number of columns and set analysis to calculate required expressions
.So,
I do not see it working if you have variable number of departments. On the other hand if there is always the same number of departments, you could create a straight table with measures using set analysis for each department/period-type.
I know it will be more work, but at least you could create those required groupings.
In other words: column headers would always be static and would be build directly in PPT template, and only values would be populated directly from Qlik
- « Previous Replies
-
- 1
- 2
- Next Replies »