Unlock a world of possibilities! Login now and discover the exclusive benefits awaiting you.
- Qlik Community
- :
- All Forums
- :
- Qlik NPrinting
- :
- Re: Pivot Table in NPrinting 16
- Subscribe to RSS Feed
- Mark Topic as New
- Mark Topic as Read
- Float this Topic for Current User
- Bookmark
- Subscribe
- Mute
- Printer Friendly Page
- Mark as New
- Bookmark
- Subscribe
- Mute
- Subscribe to RSS Feed
- Permalink
- Report Inappropriate Content
Pivot Table in NPrinting 16
Hi,
I have a Pivot table in QlikView and want to export same in N-Printing.
How do I go about it, because when exporting Pivot Table from QlikView to N-Printing it's getting converted into Straight Table.
I want the below exact table in N-Printing Excel Report Distribution.
| Group | Branch |
| Group1 | ABXC |
| XYZ | |
| Abhs | |
| hzxvch | |
| bhzb |
Can anyone pls help me.
Regards,
Renuka S
- Tags:
- qliksense
- « Previous Replies
- Next Replies »
Accepted Solutions
- Mark as New
- Bookmark
- Subscribe
- Mute
- Subscribe to RSS Feed
- Permalink
- Report Inappropriate Content
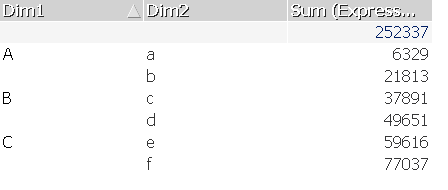
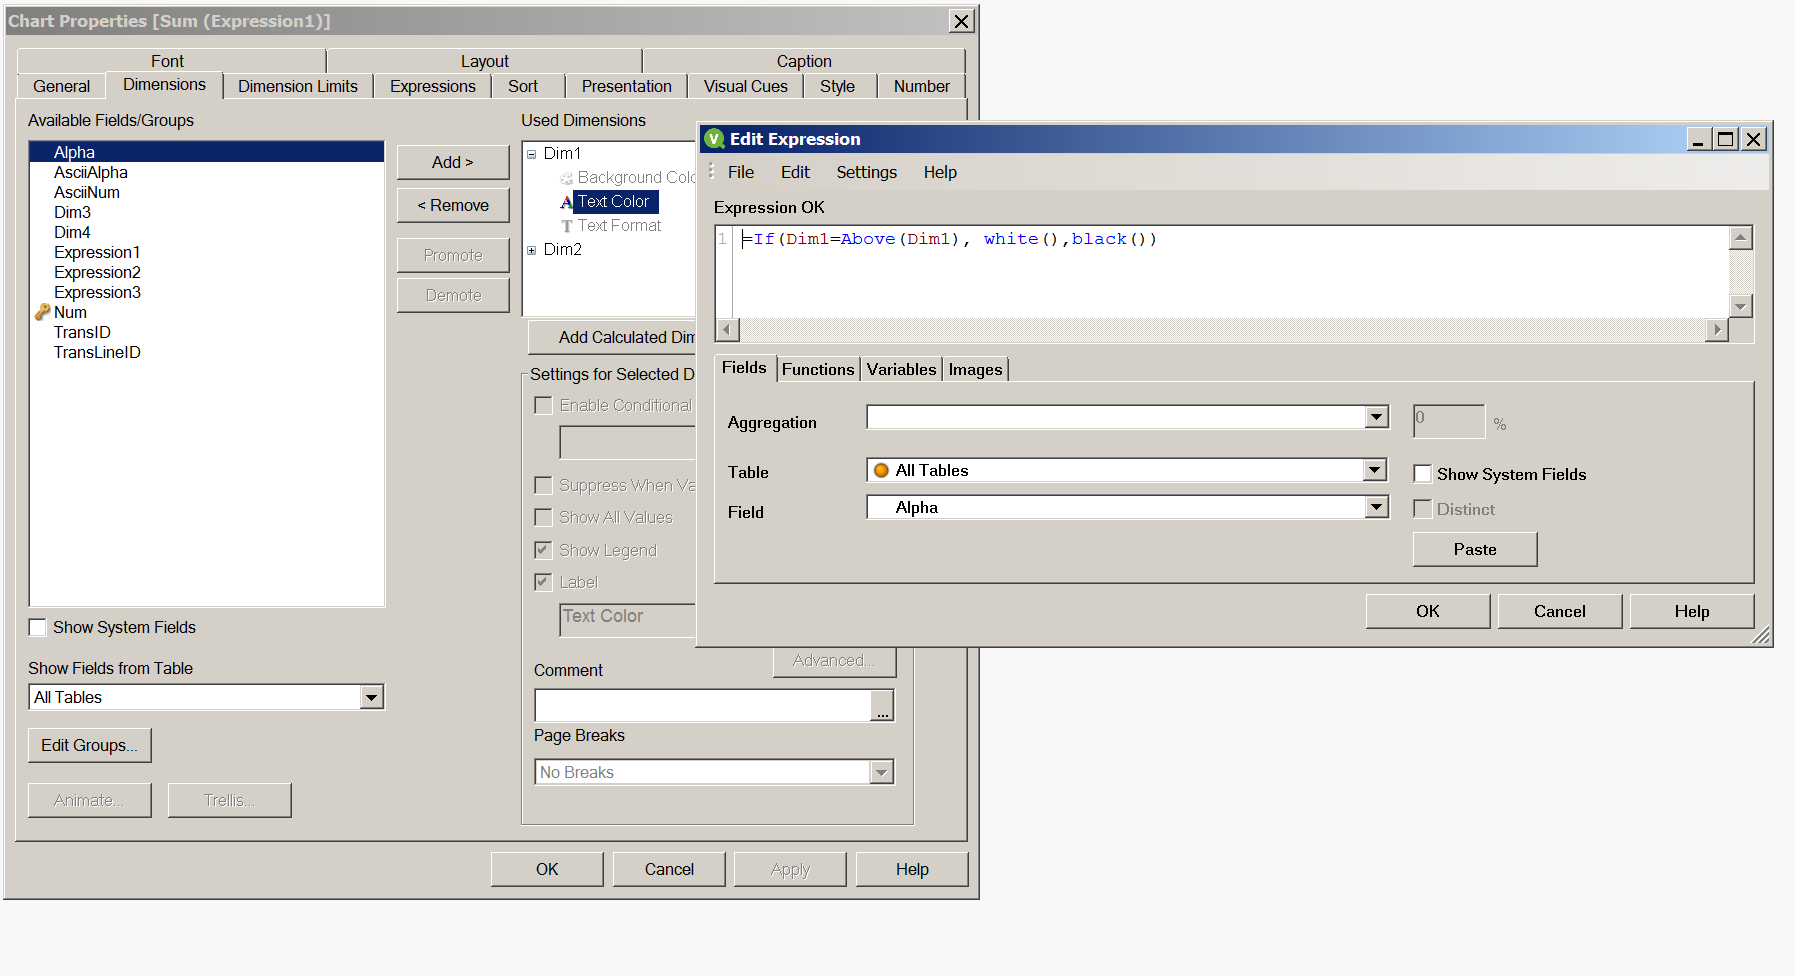
I also went back to your original question. So how about using straight table all the way with some hacks (like changing font color to white in order to hide duplicated values on dimensions.
Samle attached !
- Mark as New
- Bookmark
- Subscribe
- Mute
- Subscribe to RSS Feed
- Permalink
- Report Inappropriate Content
Hi Renuka,
1. Firstly You can take it as Image like same you designed in qlik.
2.Design pivot table using excel sheet option.
-> Firstly create straight table in qlikview/ Qliksense
-> Then go to nprinting designer
-> Add table into your excel designer sheet,
-> Seelect table range Menu Insert-> Pivot table-> Draw table as wish you.
Thanks,
Arvind Patil
- Mark as New
- Bookmark
- Subscribe
- Mute
- Subscribe to RSS Feed
- Permalink
- Report Inappropriate Content
This was discussed many times on community.. Below are examples of different solutions. Pick and choose which one suits you best.
On the other hand i am surprised what you are saying that pivot table gets converted. I tested it and it does not...check here:Nprint Pivot table formatting issue
How to Create a Pivot Table Report with QlikView Data
how to show pivot table in nprinting excel report
https://help.qlik.com/en-US/nprinting/June2018/Content/ExcelReports/Pivot-table-Excel.htm
- Mark as New
- Bookmark
- Subscribe
- Mute
- Subscribe to RSS Feed
- Permalink
- Report Inappropriate Content
Hi,
Thank You.
I already checked with the mention link. When a Pivot Table is placed in N-Printing & once you preview it, then it doesn't has the same Grouping which is seen in QlikView. see below it give the output has
| Group | Branch |
| Group1 | ABXC |
| Group1 | XYZ |
And I am not able to create Pivot using this link How to Create a Pivot Table Report with QlikView Data because my expression has Set Analysis used. So simply I can't put SUM(Sales) instead I have some conditions in it.
Regards,
Renuka S
- Mark as New
- Bookmark
- Subscribe
- Mute
- Subscribe to RSS Feed
- Permalink
- Report Inappropriate Content
I disagree
you can still do this (even with the set analysis)
- Just convert your pivot table to straight table in Qlik
- Then you dont need to do any aggregation - to be frank you can use in Excel "Max\' function as all grouping is already done in Qlik and you only need to create artifitial grouping for repeated dimension values.
regards
Lech
- Mark as New
- Bookmark
- Subscribe
- Mute
- Subscribe to RSS Feed
- Permalink
- Report Inappropriate Content
Hi,
I followed the same step, I am getting the grouping but my variables are not working.
Say for e.g. My headings of the table is vMaxMonth then it is not coming as Jul-2018, instead its giving vMaxMonth only.
I am not able to do any formatting in the created Pivot Table. Tried many ways and still trying on it.
Regards,
Renuka S
- Mark as New
- Bookmark
- Subscribe
- Mute
- Subscribe to RSS Feed
- Permalink
- Report Inappropriate Content
it is because you are not evaluating variable
depending where you are putting it you need to prefix it with = sign
- Mark as New
- Bookmark
- Subscribe
- Mute
- Subscribe to RSS Feed
- Permalink
- Report Inappropriate Content
Thanks for your prompt reply.
The same variable when I insert in second sheet, then I can see the value for it. But in the sheet where the Pivot Table is there it doesn't appear.

The same way when I insert the variable (<vDisb1> in the next sheet I am getting it.
Where vDisb1 is =='Q'&vMaxQtr &' Target per Month' . (heading for my table)
Regards,
Renuka S
- Mark as New
- Bookmark
- Subscribe
- Mute
- Subscribe to RSS Feed
- Permalink
- Report Inappropriate Content
Any reply on the above part.
Can anyone help.
Thanks in advance.
Renuka S
- Mark as New
- Bookmark
- Subscribe
- Mute
- Subscribe to RSS Feed
- Permalink
- Report Inappropriate Content
i dont get it?
is this result in nprinting Or in Qlik?
my question is how is your column label looking like in Qlik table?
you might need to use $ sign expansion to get this right, but it all depends how you evaluate your variables.
To simplify provide us with screenahots of:
- variable definition
- label expression in qlik
- result in qlik
Thanks
Lech
- « Previous Replies
- Next Replies »