Unlock a world of possibilities! Login now and discover the exclusive benefits awaiting you.
- Qlik Community
- :
- All Forums
- :
- Qlik NPrinting
- :
- Re: align table and chart in excel template
- Subscribe to RSS Feed
- Mark Topic as New
- Mark Topic as Read
- Float this Topic for Current User
- Bookmark
- Subscribe
- Mute
- Printer Friendly Page
- Mark as New
- Bookmark
- Subscribe
- Mute
- Subscribe to RSS Feed
- Permalink
- Report Inappropriate Content
align table and chart in excel template
If I put a chart next to a table in the excel template and in the table I use “expand” option for the columns. Then when data is populated in the table, the position of the chart and table will no longer align, as the number of rows to be expanded in the table can vary, what can be done to the chart side to make sure the two objects’ position could still align? I have tried insert the columns behind the chart but still don't work.
- « Previous Replies
-
- 1
- 2
- Next Replies »
Accepted Solutions
- Mark as New
- Bookmark
- Subscribe
- Mute
- Subscribe to RSS Feed
- Permalink
- Report Inappropriate Content
Hi Ronald,
Placing objects side-by-side in Excel templates is always a bit difficult because Qlik NPrinting add rows when filling the final report with data from Qlik.
With option 2 you keep everything in a single Excel template, but in 2 worksheets (you can hide the one with the raw data). Then you can add a lot of rows with Excel link to data in order to be sure that you cover the whole table.
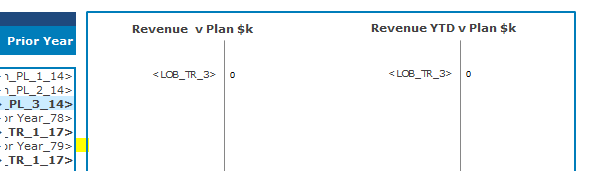
I found another possible solution. You can create a straight table with a dimension and the LOB_TR_3 column. Hide the dimension and save the Qlik document. Refrash the NPrinting cache, add the new table in the Tables node and you should see only the LOB_TR_3 column. Remove the flag on Expand range option, add the table tag (not the LOB column tag) in the report and run a preview.
Best Regards,
Ruggero
---------------------------------------------
When applicable please mark the appropriate replies as CORRECT. This will help community members and Qlik Employees know which discussions have already been addressed and have a possible known solution. Please mark threads as HELPFUL if the provided solution is helpful to the problem, but does not necessarily solve the indicated problem. You can mark multiple threads as HELPFUL if you feel additional info is useful to others.
Best Regards,
Ruggero
---------------------------------------------
When applicable please mark the appropriate replies as CORRECT. This will help community members and Qlik Employees know which discussions have already been addressed and have a possible known solution. Please mark threads with a LIKE if the provided solution is helpful to the problem, but does not necessarily solve the indicated problem. You can mark multiple threads with LIKEs if you feel additional info is useful to others.
- Mark as New
- Bookmark
- Subscribe
- Mute
- Subscribe to RSS Feed
- Permalink
- Report Inappropriate Content
Hi Ronald,
At the time of table adding into Nprinting Template. Please unchecked Keep Source Format.
May be it works for You
Thanks,
Arvind Patil
- Mark as New
- Bookmark
- Subscribe
- Mute
- Subscribe to RSS Feed
- Permalink
- Report Inappropriate Content
Hi Ronald,
It is not clear what behavior you are experiencing. Are you using levels? Are you placing the chart far enough away from the table? Etc.
These links may help:
NPrinting 16 - Chart and table side to side
Inserting a chart as image interferes with the table on the side
A sample QVW/QVF and a mock-up Excel file showing how you expect your output will help.
HTH - Daniel.
- Mark as New
- Bookmark
- Subscribe
- Mute
- Subscribe to RSS Feed
- Permalink
- Report Inappropriate Content
Hi Patil,
format is unchecked already
- Mark as New
- Bookmark
- Subscribe
- Mute
- Subscribe to RSS Feed
- Permalink
- Report Inappropriate Content
Hi Daniel,
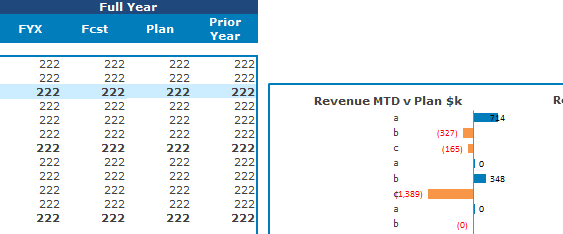
the template is set up as below, where the start of the table align to the start of the chart next to it.
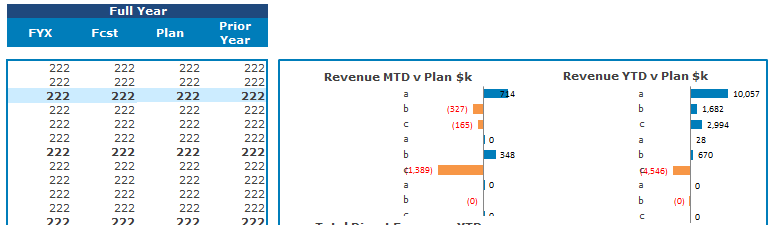
But as in the table i use expand option, more rows will be inserted to the table thus the result became, and i can not be exact how many rows will be insert thus i can not make the assumption and make adjustment accordingly in the chart.
- Mark as New
- Bookmark
- Subscribe
- Mute
- Subscribe to RSS Feed
- Permalink
- Report Inappropriate Content
Hi Ronald,
Could you post a screenshot of the original template? Thanks
Best Regards,
Ruggero
---------------------------------------------
When applicable please mark the appropriate replies as CORRECT. This will help community members and Qlik Employees know which discussions have already been addressed and have a possible known solution. Please mark threads with a LIKE if the provided solution is helpful to the problem, but does not necessarily solve the indicated problem. You can mark multiple threads with LIKEs if you feel additional info is useful to others.
- Mark as New
- Bookmark
- Subscribe
- Mute
- Subscribe to RSS Feed
- Permalink
- Report Inappropriate Content
Hi Guggero,
the template is as below where the the table and chart align, but as the table has new data input as "expand", the result chart is pushed down as shown in previous chart
- Mark as New
- Bookmark
- Subscribe
- Mute
- Subscribe to RSS Feed
- Permalink
- Report Inappropriate Content
Thanks for the template.
The "Expand range" is a table property, so its value acts only when you add the whole table as a single table into the template. If you unflag the "Expand range" check box and you drag and drop some single columns into the template the option has no effects.
I did some tests and I found two possible solutions:
1 - if you know the number of values of the LOB_TR_3 column you can add it in the Cells node as you did with the visible left part of the template. Then drag and drop each single cell into the template
2 - Disable the "Expand range" for the table, drag and drop it into a different worksheet of your template (you can hide this worksheets when you finish the template development) and insert Excel links (like =+Sheet2!B2) in the final cells.
Best Regards,
Ruggero
---------------------------------------------
When applicable please mark the appropriate replies as CORRECT. This will help community members and Qlik Employees know which discussions have already been addressed and have a possible known solution. Please mark threads as HELPFUL if the provided solution is helpful to the problem, but does not necessarily solve the indicated problem. You can mark multiple threads as HELPFUL if you feel additional info is useful to others.
Best Regards,
Ruggero
---------------------------------------------
When applicable please mark the appropriate replies as CORRECT. This will help community members and Qlik Employees know which discussions have already been addressed and have a possible known solution. Please mark threads with a LIKE if the provided solution is helpful to the problem, but does not necessarily solve the indicated problem. You can mark multiple threads with LIKEs if you feel additional info is useful to others.
- Mark as New
- Bookmark
- Subscribe
- Mute
- Subscribe to RSS Feed
- Permalink
- Report Inappropriate Content
Thanks Ruggero,
Option 2 won't work as I I won't be able to predict how many rows from the "expand range" table and when it is possible i want to keep everything in one template.
I am not exact sure if i fully understand your option 1, as the issue is not coming from the number of rows in the LOB_TR_3, the issue is coming from that when the data expand in the left table, the right chart box is skewed down.
- Mark as New
- Bookmark
- Subscribe
- Mute
- Subscribe to RSS Feed
- Permalink
- Report Inappropriate Content
Hi Ronald,
Placing objects side-by-side in Excel templates is always a bit difficult because Qlik NPrinting add rows when filling the final report with data from Qlik.
With option 2 you keep everything in a single Excel template, but in 2 worksheets (you can hide the one with the raw data). Then you can add a lot of rows with Excel link to data in order to be sure that you cover the whole table.
I found another possible solution. You can create a straight table with a dimension and the LOB_TR_3 column. Hide the dimension and save the Qlik document. Refrash the NPrinting cache, add the new table in the Tables node and you should see only the LOB_TR_3 column. Remove the flag on Expand range option, add the table tag (not the LOB column tag) in the report and run a preview.
Best Regards,
Ruggero
---------------------------------------------
When applicable please mark the appropriate replies as CORRECT. This will help community members and Qlik Employees know which discussions have already been addressed and have a possible known solution. Please mark threads as HELPFUL if the provided solution is helpful to the problem, but does not necessarily solve the indicated problem. You can mark multiple threads as HELPFUL if you feel additional info is useful to others.
Best Regards,
Ruggero
---------------------------------------------
When applicable please mark the appropriate replies as CORRECT. This will help community members and Qlik Employees know which discussions have already been addressed and have a possible known solution. Please mark threads with a LIKE if the provided solution is helpful to the problem, but does not necessarily solve the indicated problem. You can mark multiple threads with LIKEs if you feel additional info is useful to others.
- « Previous Replies
-
- 1
- 2
- Next Replies »