Unlock a world of possibilities! Login now and discover the exclusive benefits awaiting you.
- Qlik Community
- :
- All Forums
- :
- Qlik NPrinting
- :
- Re: keep level on one page
- Subscribe to RSS Feed
- Mark Topic as New
- Mark Topic as Read
- Float this Topic for Current User
- Bookmark
- Subscribe
- Mute
- Printer Friendly Page
- Mark as New
- Bookmark
- Subscribe
- Mute
- Subscribe to RSS Feed
- Permalink
- Report Inappropriate Content
keep level on one page
Is there a way to keep the information of a level to one page, or, when that is not possible to keep an object printed to the same page?
I created a report with one main chart and below that a level with a table and a graph.
when the excel template is printed to pdf, some graphs are devided over two pages. Of course I want a chart on the same page.
Using another report form (pixelperfect or word etc....) is not an option.
- Mark as New
- Bookmark
- Subscribe
- Mute
- Subscribe to RSS Feed
- Permalink
- Report Inappropriate Content
Set the page layout inside the Excel template itself.
In the designer, go to Page Layout on the Excel toolbar:
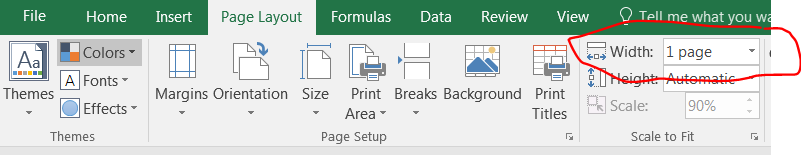
Preview the report in PDF format to verify.
- Mark as New
- Bookmark
- Subscribe
- Mute
- Subscribe to RSS Feed
- Permalink
- Report Inappropriate Content
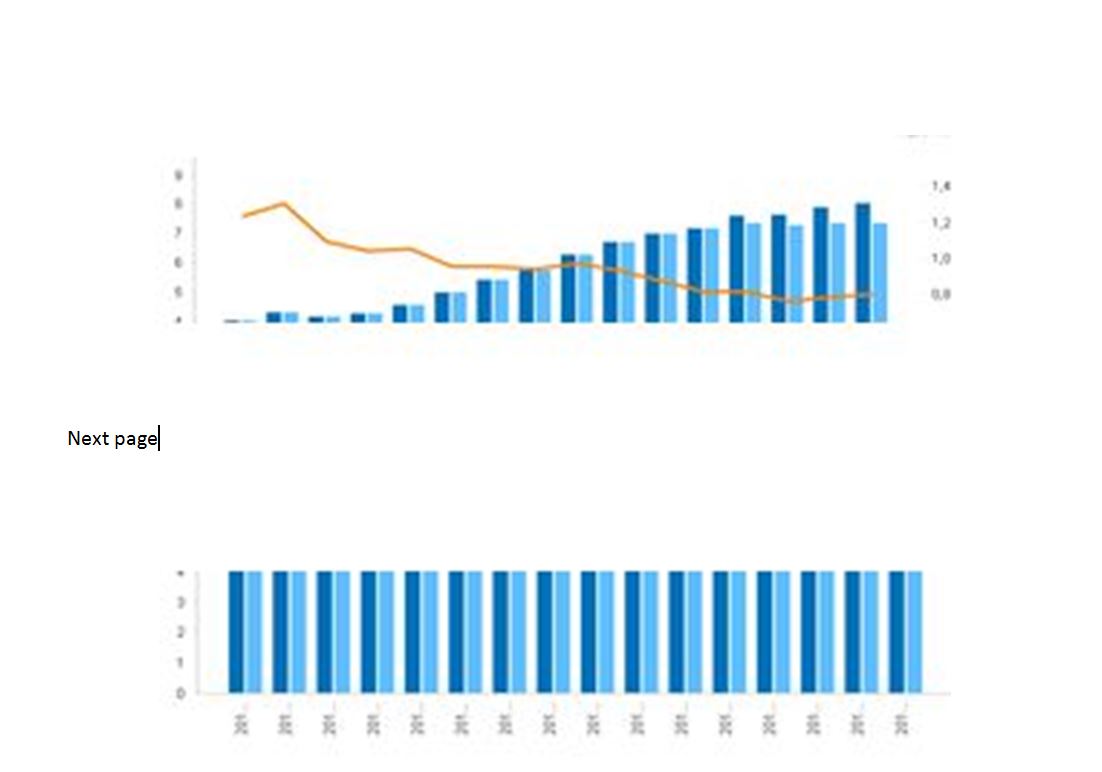
I am afraid I did not make myself clear,so I add a picture of what is happening. I allready did set the width of the page.
I cannot set the height , because sometimes there are multiple charts
- Mark as New
- Bookmark
- Subscribe
- Mute
- Subscribe to RSS Feed
- Permalink
- Report Inappropriate Content
I think you have to set the page layout parameters (margins, orientation, size, etc) and the charts dimensions.
In case could you post the template?
Best Regards,
Ruggero
---------------------------------------------
When applicable please mark the appropriate replies as CORRECT. This will help community members and Qlik Employees know which discussions have already been addressed and have a possible known solution. Please mark threads with a LIKE if the provided solution is helpful to the problem, but does not necessarily solve the indicated problem. You can mark multiple threads with LIKEs if you feel additional info is useful to others.
- Mark as New
- Bookmark
- Subscribe
- Mute
- Subscribe to RSS Feed
- Permalink
- Report Inappropriate Content
I have to change a lot of the template before I post it, so I will try to explain the structure of :
Top of sheet
.<TX01>
<TX02>
<ch01>
<ch02>
<level01>
<TX03>
<CH01>
<CH02>
</level01>
The first level block should be printed at the first page together with the top of sheet.
The next level block should be printed at the next pages.
Challenge 1. A level block has to be printed at the same page
Challenge 2. Per two level blocks appearances one page
Charts do not always have the same height.
The number of levels differ per dimension
So, where do I have put pagebreaks´s ?
- Mark as New
- Bookmark
- Subscribe
- Mute
- Subscribe to RSS Feed
- Permalink
- Report Inappropriate Content
I hope I have to understand well. I think you cannot have this kind of fine control on page breaks on PDF produced from an Excel template due to the nature of Excel that is not designed to produce well formatted PDFs but to create analysis models.
If you insert a page break in a Qlik NPrinting Excel template level only the first page break will be copied in the final report right now (June 2017). Following page breakes are not copied (2nd, 3th, etc) as it happens in Word templates.
So if using Excel is mandatory and charts do not always have the same height I think the only solution to have a fine control of the pages layout is to:
- Remove the level
- Insert a copy of the charts you need into the template for each value of the fiels in the level
- Add an object filter in each chart
- Control each chart dimensions by setting its properties
- Insert pagebreaks exactly where you want the break
- Use the Excel PAge Break Preview to fine se the pages
Of course this solution is very long to be implemented and it is feaseable only if the number of distinc values in the level is limited.
The suggested template type to get high quality and control of the output in PDF is PixelPerfect.
Best Regards,
Ruggero
---------------------------------------------
When applicable please mark the appropriate replies as CORRECT. This will help community members and Qlik Employees know which discussions have already been addressed and have a possible known solution. Please mark threads with a LIKE if the provided solution is helpful to the problem, but does not necessarily solve the indicated problem. You can mark multiple threads with LIKEs if you feel additional info is useful to others.
- Mark as New
- Bookmark
- Subscribe
- Mute
- Subscribe to RSS Feed
- Permalink
- Report Inappropriate Content
I cannot implement your solution, because the number of level values per "main-dimension" differ.
Besides that: I can't hardcode filters for each chart,because they differ too
Allthough : perhaps I can give every level value an ascending number
I will look at your suggestion to use Pixelperfect. Tried it only once