Unlock a world of possibilities! Login now and discover the exclusive benefits awaiting you.
- Qlik Community
- :
- All Forums
- :
- Qlik NPrinting
- :
- nPrinting Word based report
- Subscribe to RSS Feed
- Mark Topic as New
- Mark Topic as Read
- Float this Topic for Current User
- Bookmark
- Subscribe
- Mute
- Printer Friendly Page
- Mark as New
- Bookmark
- Subscribe
- Mute
- Subscribe to RSS Feed
- Permalink
- Report Inappropriate Content
nPrinting Word based report
Is it possible to take a straight table from qlikview and create the following report in an nPrint Word Report?
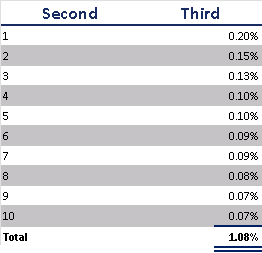
or what are some options to duplicate this?
- « Previous Replies
-
- 1
- 2
- Next Replies »
Accepted Solutions
- Mark as New
- Bookmark
- Subscribe
- Mute
- Subscribe to RSS Feed
- Permalink
- Report Inappropriate Content
Hi Stephen,
Since you want the final output in PDF format, and the resolution is important to you, I suggest you use the PixelPerfect report type. It is very powerful and you have a lot of control over how things look. Here is a screenshot of the PDF output at 100% and 400%.

The project I used is attached. Extract to folder C:\Temp\Community\059 or change the paths in the NSQ.
HTH - Daniel.
- Mark as New
- Bookmark
- Subscribe
- Mute
- Subscribe to RSS Feed
- Permalink
- Report Inappropriate Content
Within your NPrinting Word report, Right Click on Images > Add Objects > Select the table > Drag onto your word report.
Does this give you what you require?
- Mark as New
- Bookmark
- Subscribe
- Mute
- Subscribe to RSS Feed
- Permalink
- Report Inappropriate Content
Hi Stephen,
Why not use one of the existing MS Word Table Styles?

Or create your own: Word: Modify and Create Custom Table Style
HTH - Daniel.
- Mark as New
- Bookmark
- Subscribe
- Mute
- Subscribe to RSS Feed
- Permalink
- Report Inappropriate Content
Stephen,
I agree with Andrew. Since you are using a Word template rather than Excel, it seems to imply that you only need to see the chart in Word and not have access to the raw data for your end user. Format your object exactly like you want it in Qlikview and then capture an image of it with Andrews directions.
I will say that my personal preference is power point for distribution. Word can be funky about anchoring images to a particular location on your document, especially if the size of the image changes. You might also review this post about exporting image quality at a higher level.
- Mark as New
- Bookmark
- Subscribe
- Mute
- Subscribe to RSS Feed
- Permalink
- Report Inappropriate Content
As stated above, an image quality at 400 and reduced back to size is still does a poor job.
If anyone can replicate the chart example in any nPrinting method other than a screen capture, please show me, with steps.
The end report has about 40 different charts presenting from one to 20 columns plus free-floating headers.
Qlikview reporting does a good job for presenting the data, but we need the functionality in nPrinting for distribution.
- Mark as New
- Bookmark
- Subscribe
- Mute
- Subscribe to RSS Feed
- Permalink
- Report Inappropriate Content
Can you show us an example of your "poor" quality image at 400 DPI? I know it looks terrible at 100, but IMO it is very presentable at 400 DPI.
- Mark as New
- Bookmark
- Subscribe
- Mute
- Subscribe to RSS Feed
- Permalink
- Report Inappropriate Content
No. It is the resulting PDFs that are printed out. We have been using Qlikview reporting tool and creating PDFs...the results are clean and professional looking.
nPrinting screen shots, not so much.
TO duplicate, make a simple chart and place it in a qlikview report and the. To PDF and print it.
now do the same in nPrinting with the best possible image resolution and PDF then print.
COmpare the results.
- Mark as New
- Bookmark
- Subscribe
- Mute
- Subscribe to RSS Feed
- Permalink
- Report Inappropriate Content
Well, now I am in agreement with you. If you convert your result to PDF out of Nprinting, you definitely do not get the same great image quality. That has been my experience too. The conversion to PDF out of Nprinting is also limited to a page count of about 60-75 in my experience without it giving an error.
However, you can distribute your report in one of the Office formats and it maintains great quality at 400 DPI. I have generated an 1100 page document in PPT. File size gets a little unmanageable with a report that big. Even a 50 page report with 50 images is about 5 MB in size.
You may need to consider changing your delivery method to use Nprinting with high quality.
- Mark as New
- Bookmark
- Subscribe
- Mute
- Subscribe to RSS Feed
- Permalink
- Report Inappropriate Content
If your worried about image quality I'd recommend using a word table, this way the data is being returned as actual text so there's no image quality issues.
In your Nprinting word report go to tables > Add objects > then expand the tables, expand the table you have added in from Qlikview. You will now have your column values which you can drag and drop into a standard word table.
Hope this makes sense.
- Mark as New
- Bookmark
- Subscribe
- Mute
- Subscribe to RSS Feed
- Permalink
- Report Inappropriate Content
We have tried this and even with table formatting, we cannot duplicate the simple table chart object first shown without many machinations...but let me see what level of tweaking on this gets us closest, then I can respond.
- « Previous Replies
-
- 1
- 2
- Next Replies »