Unlock a world of possibilities! Login now and discover the exclusive benefits awaiting you.

Announcements
Q&A with Qlik - Qlik Cloud Migration: Questions about migrating to Qlik Cloud? Catch the latest replay!
- Qlik Community
- :
- All Forums
- :
- Qlik NPrinting
- :
- Format for more than 24 hours
Options
- Subscribe to RSS Feed
- Mark Topic as New
- Mark Topic as Read
- Float this Topic for Current User
- Bookmark
- Subscribe
- Mute
- Printer Friendly Page
Turn on suggestions
Auto-suggest helps you quickly narrow down your search results by suggesting possible matches as you type.
Showing results for

 nicalbert
Partner - Contributor III
2018-04-30
10:36 AM
- Mark as New
- Bookmark
- Subscribe
- Mute
- Subscribe to RSS Feed
- Permalink
- Report Inappropriate Content
Format for more than 24 hours
Hi everyone,
I need to display total number of hours in a PixelPerfect chart (output is a PDF). As you can see below, the Qlikview chart shows 30:18:38 but the nPrinting chart shows 06:18:38 with a grid line at 00:00:00 (which makes the same number)
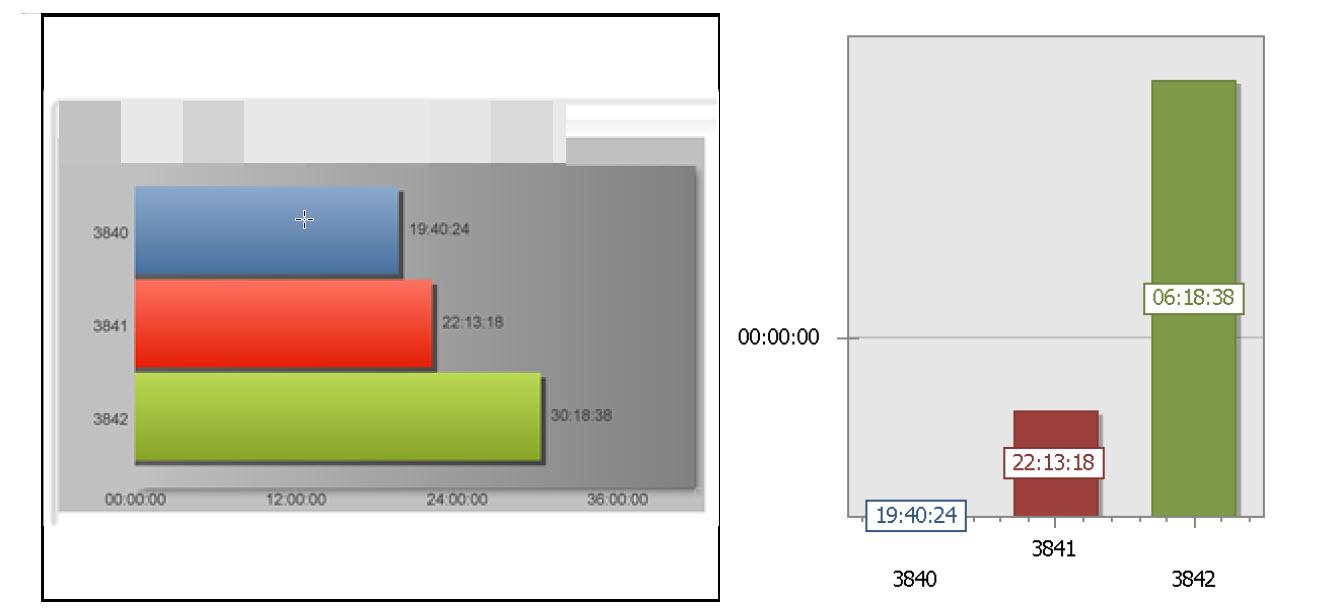
I can't figure out how to set nPrinting to show hours in the same format (like 30:18:38)? Alos, how do I set the Y axis to show values from zero to let's say 40:00:00 (and not days...).
Thanks for your help!
486 Views
0 Replies
