Unlock a world of possibilities! Login now and discover the exclusive benefits awaiting you.
- Qlik Community
- :
- All Forums
- :
- Qlik NPrinting
- :
- Re: How to create tables in pixel perfect report i...
- Subscribe to RSS Feed
- Mark Topic as New
- Mark Topic as Read
- Float this Topic for Current User
- Bookmark
- Subscribe
- Mute
- Printer Friendly Page
- Mark as New
- Bookmark
- Subscribe
- Mute
- Subscribe to RSS Feed
- Permalink
- Report Inappropriate Content
How to create tables in pixel perfect report in nprinting
Hi all,
I have created a pixel perfect report in nprinting with 10 pages.
I want to add tables into 3,5,7,9th pages but I'm not able to do this.
Because my all the tables are starting from 10th page only. Because "Detail Report" area is going to be inserted after "Detail " area.
so how can I sort out this problems?
- Tags:
- qliksense
- Mark as New
- Bookmark
- Subscribe
- Mute
- Subscribe to RSS Feed
- Permalink
- Report Inappropriate Content
yes ,
up and down
like top - graph
bottom- table
Similarly, in alternate ways
because we are not displaying any data in a graph to read and understand the graph we want to add table below the graph.
- Mark as New
- Bookmark
- Subscribe
- Mute
- Subscribe to RSS Feed
- Permalink
- Report Inappropriate Content
As of now we have also the same thing,
Detail ----It contains around 50 graphs
DetailReport---- contain around 12 tables.
Because DetailReport always comes after Detail section so all the tables are coming after all the graphs.
So, we want to place native pixel-perfect table just below the Native pixel perfect chart
- Mark as New
- Bookmark
- Subscribe
- Mute
- Subscribe to RSS Feed
- Permalink
- Report Inappropriate Content
Sorry mate- i dont get it.
what is the layout?
this (table and charts one under/above another)?
or like in my previous image in other post (chart NEXT TO TABLE)
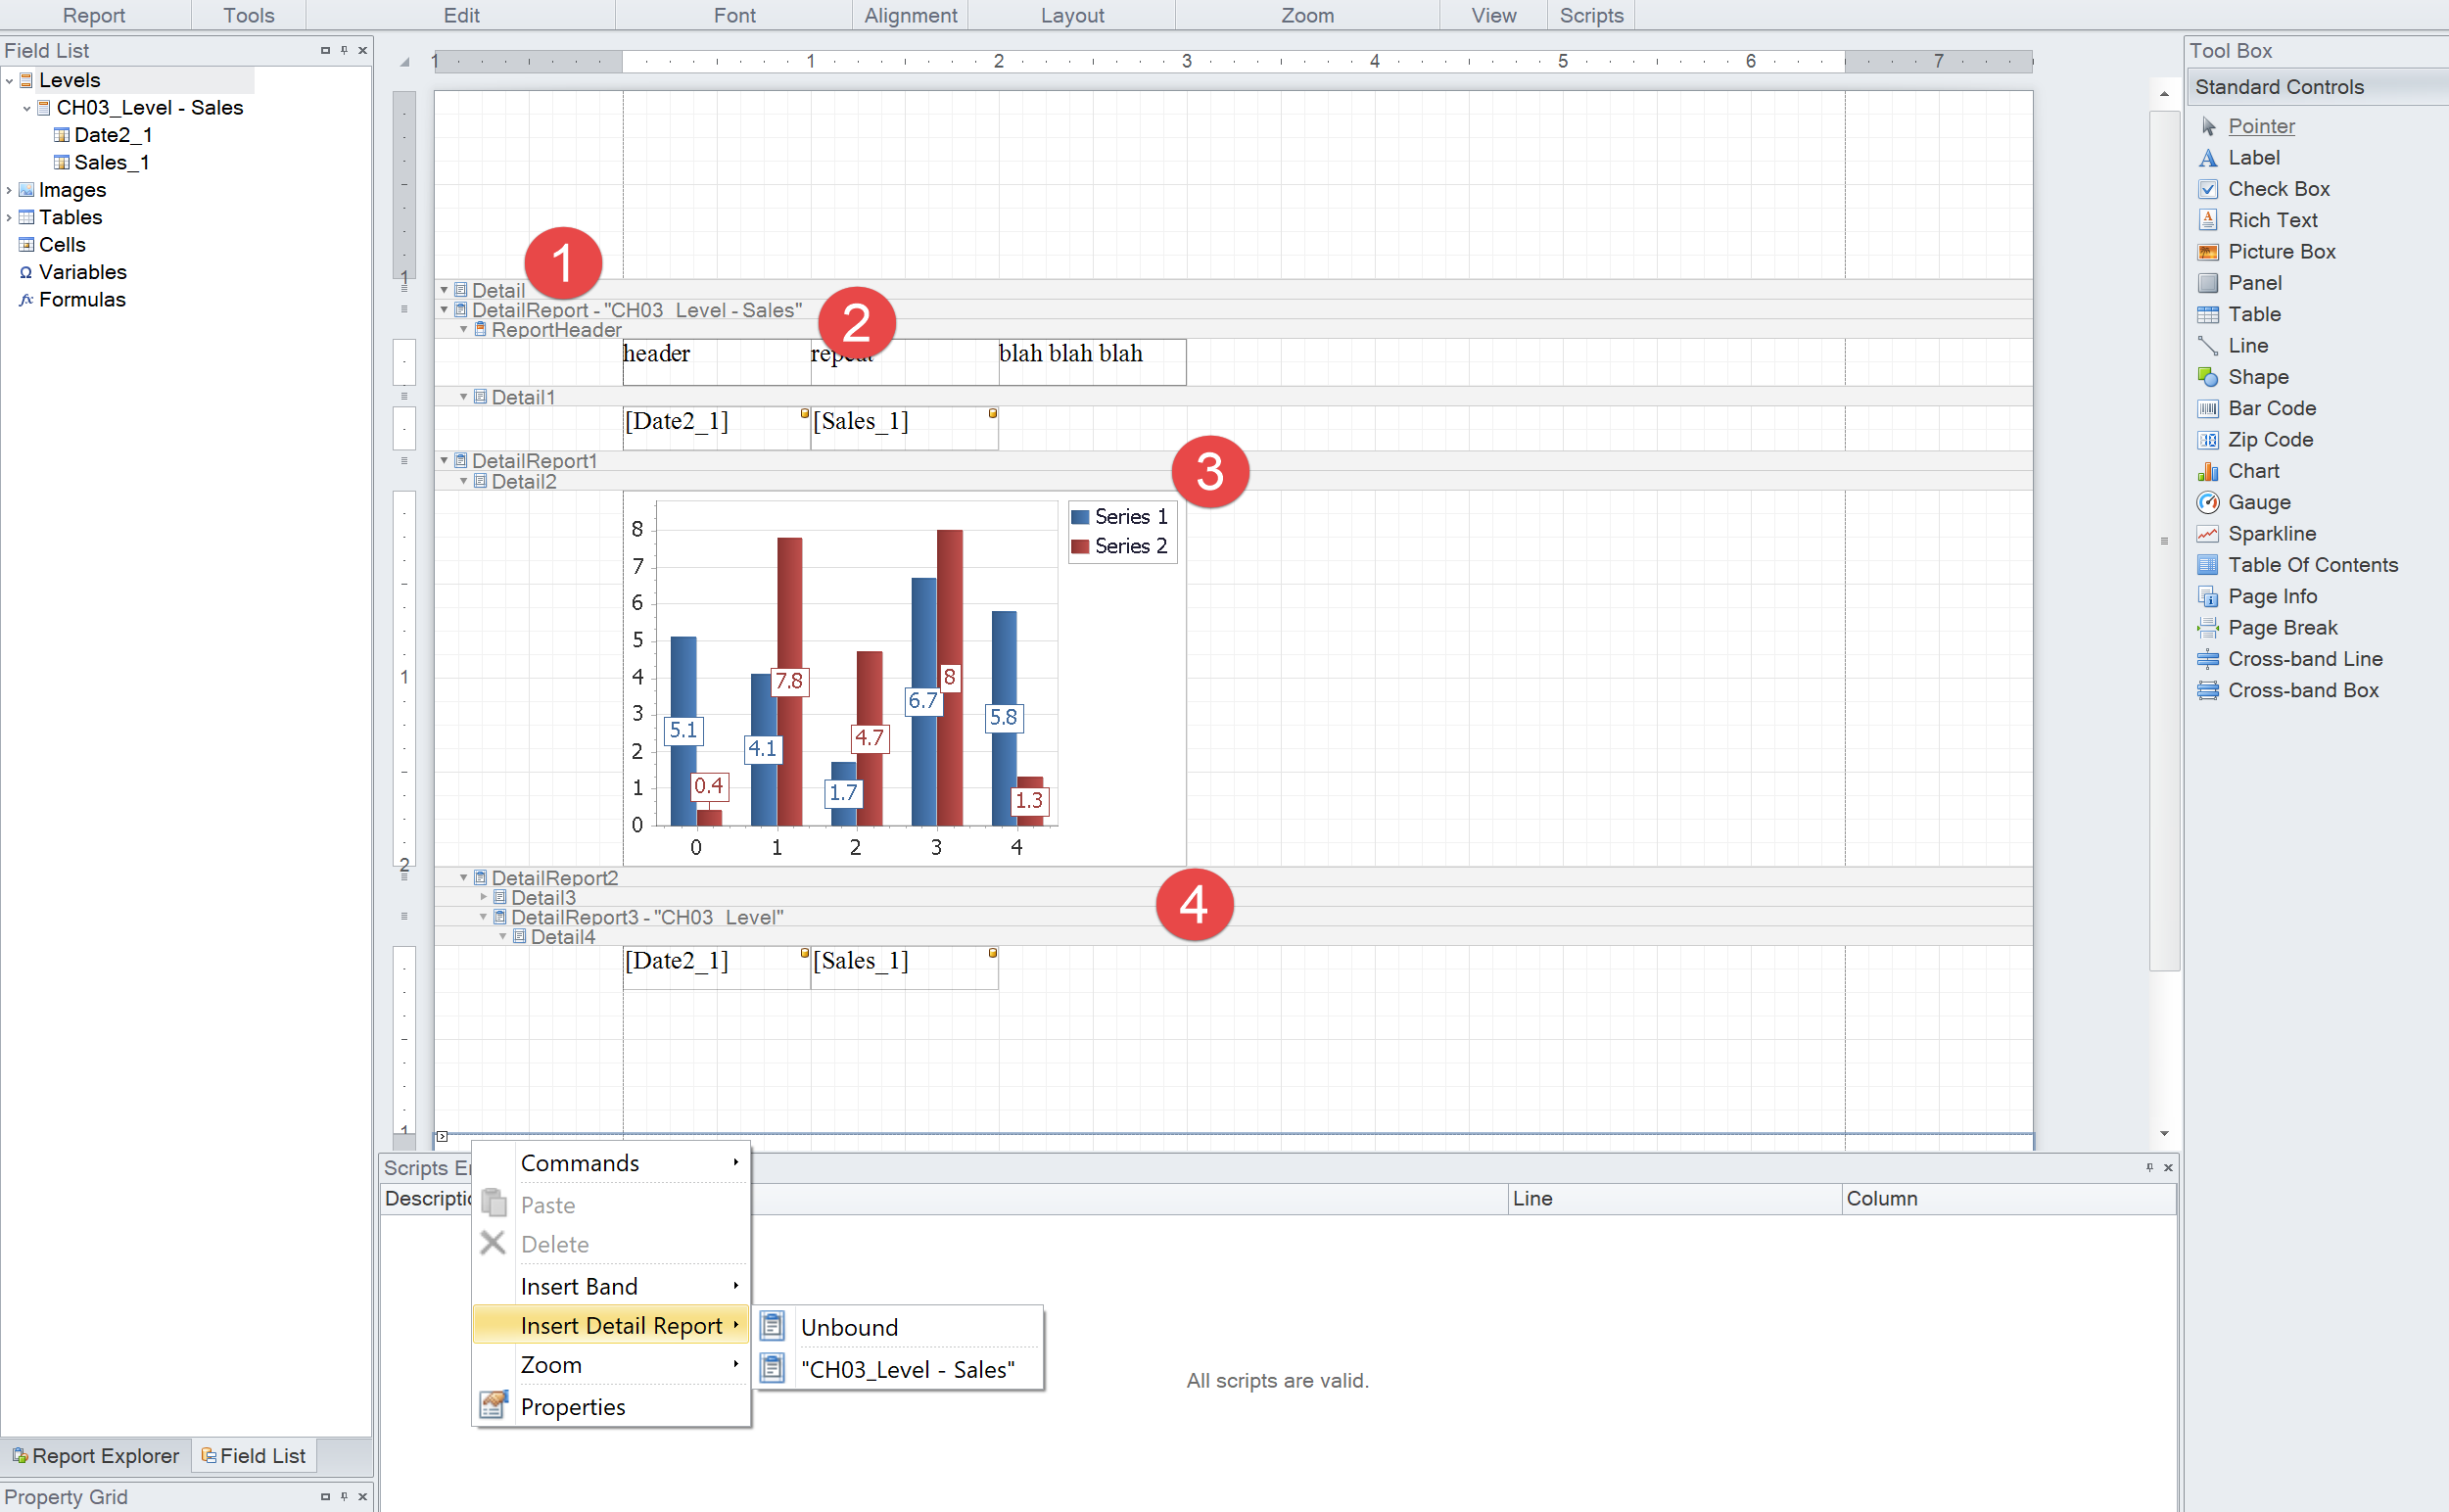
If it is ONE UNDER ANOTHER then i really do not see problem - you can add as many detailed bands to your report as you like, you can nest one band in another etc..
YOU JUST HAVE TO PLAN AHEAD HOW YOUR REPORT WILL BE STRUCTURED
see example below:
- Mark as New
- Bookmark
- Subscribe
- Mute
- Subscribe to RSS Feed
- Permalink
- Report Inappropriate Content
Like this top graph or native pixel perfect chart
bottom pixel prefect table

after this:-

same for all the graphs I need one table below the graph
- Mark as New
- Bookmark
- Subscribe
- Mute
- Subscribe to RSS Feed
- Permalink
- Report Inappropriate Content
so what is the problem?
like on my screenshot of the PixelPerfect template - create as many detailed report bands as you need and in each of those bands you can nest chart, table, level etc...
- Mark as New
- Bookmark
- Subscribe
- Mute
- Subscribe to RSS Feed
- Permalink
- Report Inappropriate Content
Actually first graph I have created in the "Deatil Section"
Now I need to create table. So I have added a table in the "Level object" then I have added a "DeatilReport" section.
Now in that DetailReport Section I have created a table .
So,
One graph and one table is done .Top one is graph and bottom one is table.
Next now I need to create a 2nd graph after the first table so How can I add that graph after the table ?
As of now I have created all the graphs in the same "Detail" Section and for tables I have created one "DetailReport"
section. So all the graphs ae coming first together and all the table are coming one after another after completing all the graphs.


But I want to create graphs and table in a alternate way
- Mark as New
- Bookmark
- Subscribe
- Mute
- Subscribe to RSS Feed
- Permalink
- Report Inappropriate Content
add another "INSERT detailed report"-"Unbound" band as many times as you need.... in each band you can put nested bands ( if required) or charts or levels..
sorry i do not know how can i explain better - you have got this all on my screenshot
- Mark as New
- Bookmark
- Subscribe
- Mute
- Subscribe to RSS Feed
- Permalink
- Report Inappropriate Content
thanks I got .I will do this.
I tried that but I think that this is not a proper way. So, I stopped that. Because Qlik Video they are using Detail section for graphs and Detail report section for tables
- Mark as New
- Bookmark
- Subscribe
- Mute
- Subscribe to RSS Feed
- Permalink
- Report Inappropriate Content
Actually I just want the confirmation that unbounding band and creating new band after that band and placing the visuals in that one is correct or not.
Thanks for response
- Mark as New
- Bookmark
- Subscribe
- Mute
- Subscribe to RSS Feed
- Permalink
- Report Inappropriate Content
They are using basic concept there just to show the technik to build table and charts so there was no requirement for additional bands.