Unlock a world of possibilities! Login now and discover the exclusive benefits awaiting you.
- Qlik Community
- :
- All Forums
- :
- Qlik NPrinting
- :
- NPrinting - Pivot table headers in excel template
- Subscribe to RSS Feed
- Mark Topic as New
- Mark Topic as Read
- Float this Topic for Current User
- Bookmark
- Subscribe
- Mute
- Printer Friendly Page
- Mark as New
- Bookmark
- Subscribe
- Mute
- Subscribe to RSS Feed
- Permalink
- Report Inappropriate Content
NPrinting - Pivot table headers in excel template
Hi,
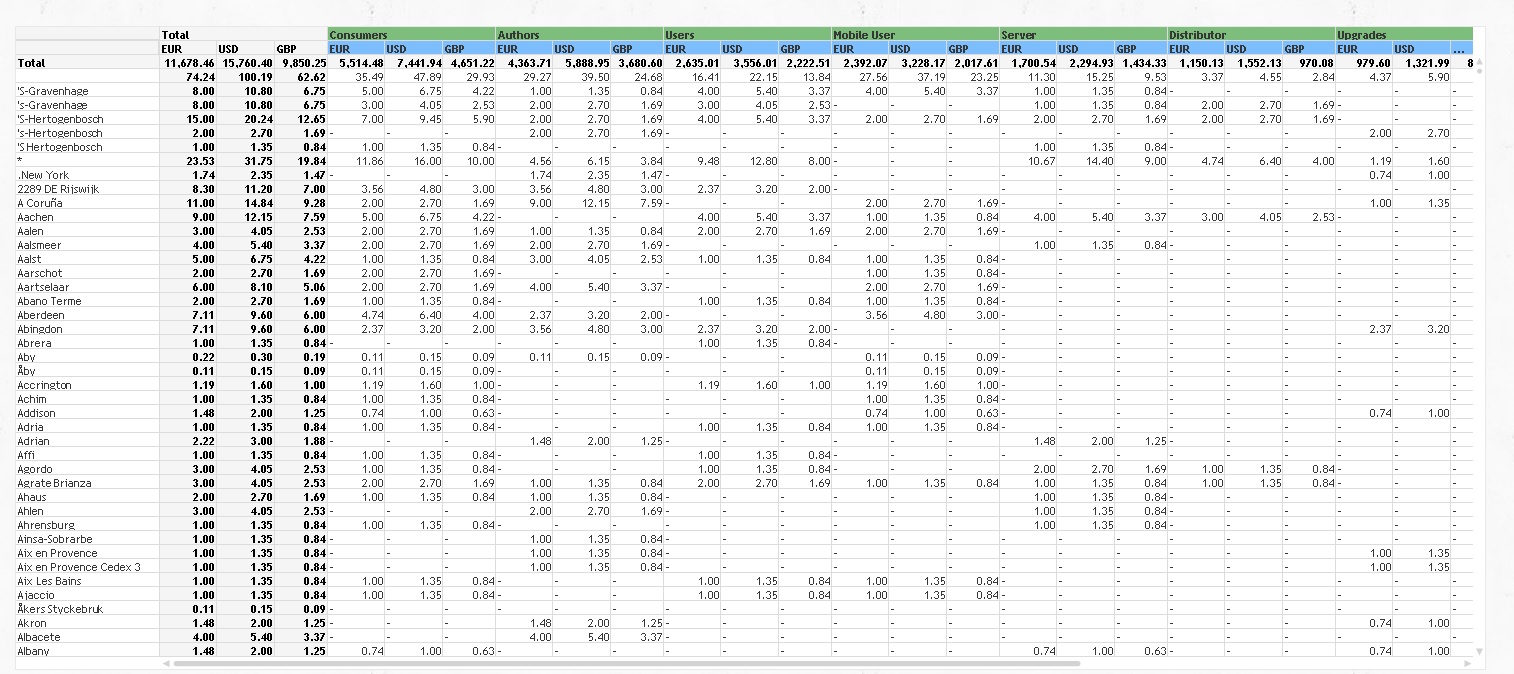
I have the following pivot table in a QlikView document (this is an example):
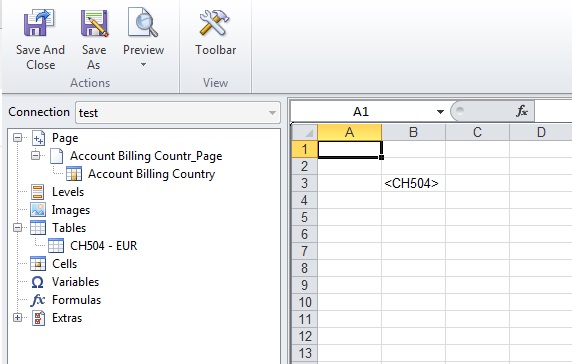
I need to generate daily reports in pdf to send it by mail. I'm using an excel template Nprinting as follows (very simple):
The result to be generated PDF is as follows:
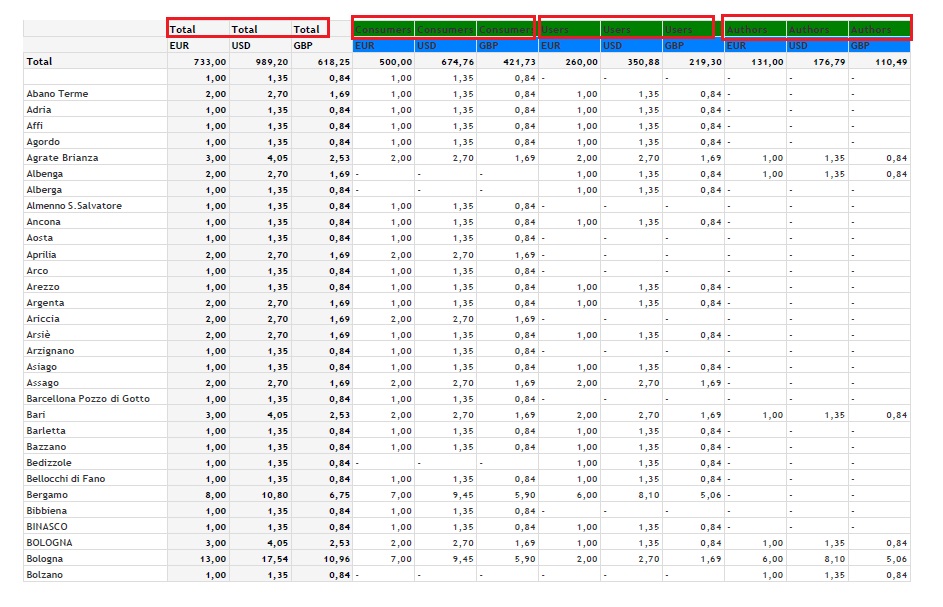
The headers are not combined and need to stay together. Can I use VBA script in Excel template to force the cell formatting? I tried in a trigger but not working...
There any way to do this kind of reports?
Thanks,
- Mark as New
- Bookmark
- Subscribe
- Mute
- Subscribe to RSS Feed
- Permalink
- Report Inappropriate Content
Have you tried to import the object as image? It should work for pdf.
- Mark as New
- Bookmark
- Subscribe
- Mute
- Subscribe to RSS Feed
- Permalink
- Report Inappropriate Content
Hi,
It works if the graphic occupies as much a page but does not work if the graph occupies 2 or more pages....
- Mark as New
- Bookmark
- Subscribe
- Mute
- Subscribe to RSS Feed
- Permalink
- Report Inappropriate Content
The issue you may run into is the way QlikView exports pivot tables. An option if you want a true pivot table in NPrinting is to make a copy of your pivot table as a straight table in QlikView and bring the straight table version into NPrinting - there are steps you can follow (see link below) where you can convert the straight table to a pivot and do formatting, etc.
How to Create a Pivot Table from Excel Table Columns – Customer Feedback for Vizubi
If the table is brought into nprinting as a pivot table, you have no control or formatting options like a straight table (and have less, if that is possible, when you bring in as an image)
- Mark as New
- Bookmark
- Subscribe
- Mute
- Subscribe to RSS Feed
- Permalink
- Report Inappropriate Content
I see what you mean. Maybe you can think about Macro if you export it as Excel. (The macro runs when user opens the excel file). But I am not sure about PDF export....