Unlock a world of possibilities! Login now and discover the exclusive benefits awaiting you.
- Qlik Community
- :
- All Forums
- :
- Qlik NPrinting
- :
- Qlik Sense Pivot Table not displaying correctly in...
- Subscribe to RSS Feed
- Mark Topic as New
- Mark Topic as Read
- Float this Topic for Current User
- Bookmark
- Subscribe
- Mute
- Printer Friendly Page
- Mark as New
- Bookmark
- Subscribe
- Mute
- Subscribe to RSS Feed
- Permalink
- Report Inappropriate Content
Qlik Sense Pivot Table not displaying correctly in PowerPoint
I am referencing a pivot table in a Qlik Sense app as an image from an NPrinting PowerPoint report.
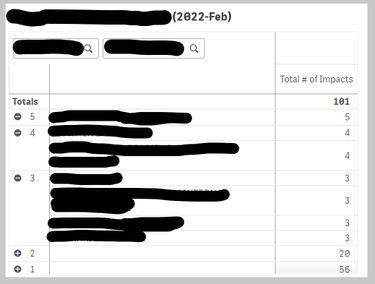
Below is an image of what the pivot table looks like in Qlik Sense.
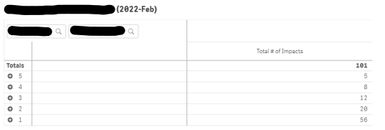
Below is an image of how the image is rendering in PowerPoint. I have NOT found a way to make it so that the data is expanded. What am I missing???
- Mark as New
- Bookmark
- Subscribe
- Mute
- Subscribe to RSS Feed
- Permalink
- Report Inappropriate Content
Hi @jlongoria
Thank you for provided this level of clear detail about the issue. As such:
- I have tested and received the same result despite having it fully expanded in the Qlik Sense app as shown in the 2nd image below:
- Keep in mind that even if you could fully expand the rows, if you have too many rows that go off the sheet in any Qlik Sense chart used in a Powerpoint exported report, those rows will not expand to the next PPTX slide.
Wish I could give you better news on this. However others here may have suggestions for you beyond what I have shared.
- Mark as New
- Bookmark
- Subscribe
- Mute
- Subscribe to RSS Feed
- Permalink
- Report Inappropriate Content
How does it render if you add it to the tables node?
- Mark as New
- Bookmark
- Subscribe
- Mute
- Subscribe to RSS Feed
- Permalink
- Report Inappropriate Content
You may try below properties to configure data resolution, means to show more content in a given space. Probably it would show pivot expanded if enough space is available, not sure though.
- Mark as New
- Bookmark
- Subscribe
- Mute
- Subscribe to RSS Feed
- Permalink
- Report Inappropriate Content
Tested both...similar result
- Mark as New
- Bookmark
- Subscribe
- Mute
- Subscribe to RSS Feed
- Permalink
- Report Inappropriate Content
I wanted to share a possible workaround that may still allow you to use powerpoint as a report format option despite the fields not expanding.
In this example I created a QS table with two dimensions - "Year" and "Product Name". Then reload the NPrinting Connection to the source QVF.
In the template editor
- add the year product named table to the 'page' feature
- add two slides
- First slide contains the chart tag (as you have it now)
- Second slide contains the Product Name field tag and the same chart tag as slide one.
- Preview
Result:
- Slide 1: summary of 3 years of data
- Subsequent slides: Product name data per year
See attached report sample.
If you like I also attached the QVF and NPrinting report.
Note that I created a filter with only 3 products so as to reduce the amount of time to product the report.
Kind regards...


