Unlock a world of possibilities! Login now and discover the exclusive benefits awaiting you.
- Qlik Community
- :
- All Forums
- :
- Qlik NPrinting
- :
- Re: nPrinting 17 Excel output columns shifted
- Subscribe to RSS Feed
- Mark Topic as New
- Mark Topic as Read
- Float this Topic for Current User
- Bookmark
- Subscribe
- Mute
- Printer Friendly Page
- Mark as New
- Bookmark
- Subscribe
- Mute
- Subscribe to RSS Feed
- Permalink
- Report Inappropriate Content
nPrinting 17 Excel output columns shifted
Hi,
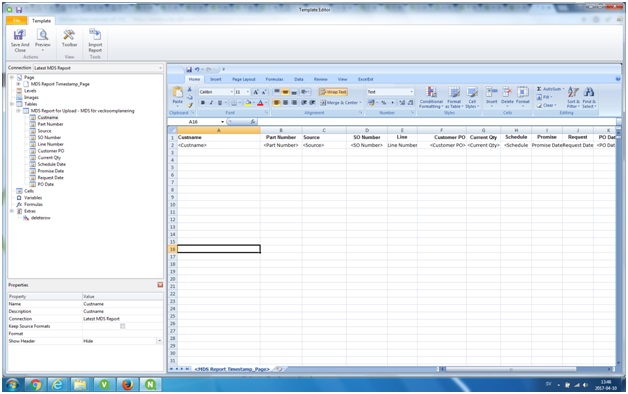
I have a table (Chart Straight Table) that I want to output in nPrinting.
Problem is that the data columns gets shifted one column to the left.
Has anyone experienced this problem in nPrinting 17 and Qlikview 12?
Designer File:
Output File:
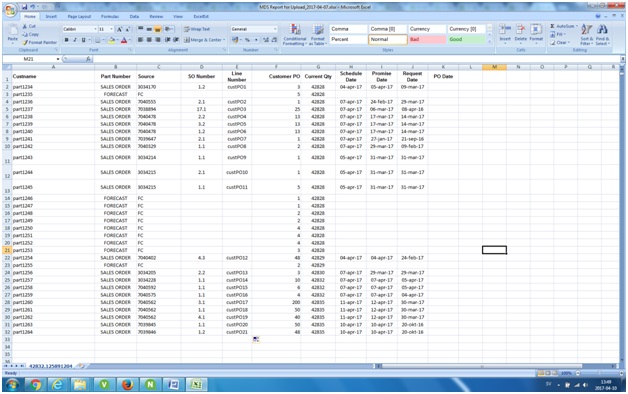
This worked just fine in previous version of nPrinting.
Regards,
Jonas
Accepted Solutions
- Mark as New
- Bookmark
- Subscribe
- Mute
- Subscribe to RSS Feed
- Permalink
- Report Inappropriate Content
Hi
I had the same situation. In my case it was related to hidden Dimensions or Measures in my source QlikView chart table.
I ended up keeping all columns visible and everything started working as expected.
Regards
Lech
- Mark as New
- Bookmark
- Subscribe
- Mute
- Subscribe to RSS Feed
- Permalink
- Report Inappropriate Content
Looking at your example the Show header is set to hide and yet in your preview the custname is visible. PErhaps your issue is related. try not hiding the column header and see if your data returns.
- Mark as New
- Bookmark
- Subscribe
- Mute
- Subscribe to RSS Feed
- Permalink
- Report Inappropriate Content
Hi
I had the same situation. In my case it was related to hidden Dimensions or Measures in my source QlikView chart table.
I ended up keeping all columns visible and everything started working as expected.
Regards
Lech
- Mark as New
- Bookmark
- Subscribe
- Mute
- Subscribe to RSS Feed
- Permalink
- Report Inappropriate Content
This resolves this issue but I does mean that my Qlikview applikation needs to show all columns which is annoying.
Regards,
Jonas
- Mark as New
- Bookmark
- Subscribe
- Mute
- Subscribe to RSS Feed
- Permalink
- Report Inappropriate Content
That is true,
However as a best practice usually you have dedicated sheet (visible only for NPrinting user) with copies of objects you utilize in NPrinting reporting. This then is not visible for end users and it is not so much annoying anymore.
My best practice though is to have dedicated for NPrinting reporting QlikView application. This is usually loaded only with fields and objects i need for reporting which then works usually much faster and is easier to work with. This also is not affecting my application used by users. I know it is "double work" as you need to maintain 2 applications but from performance point of view is much better solution. I usually use binary load or full optimized QVD load to feed source to NPrinting QlikView App
regards
Lech
- Mark as New
- Bookmark
- Subscribe
- Mute
- Subscribe to RSS Feed
- Permalink
- Report Inappropriate Content
I also experienced this (NP 17.5) but it was not due to hidden columns in my chart. In my case, it turned out to be that when I changed the order of the columns in my chart, republished it to Access Point, reloaded the metadata in NP, and then updated my chart in the NP report designer, it didn't render the column order correctly. I had to remove the chart from the Tables node in NP designer and re-add it, and also remove and re-add the columns to the excel layout.