Unlock a world of possibilities! Login now and discover the exclusive benefits awaiting you.
- Qlik Community
- :
- Discover
- :
- Blogs
- :
- Product
- :
- Product Innovation
- :
- "A Day in the Life of a Dashboard Developer..."
- Subscribe to RSS Feed
- Mark as New
- Mark as Read
- Bookmark
- Subscribe
- Printer Friendly Page
- Report Inappropriate Content
Many organizations have a dedicated person, or a group of people, responsible for creating visualizations to help guide business users on their decision-making process. For the lack of a better term, let's call those people the "Dashboard Developers."
Every day they face the task of transforming a collection of requirements into an insightful combination of data visualization objects. That can be a challenge.
As a dashboard developer, let's imagine we are creating an application for a group of users within the Sales organization. These individuals need to perform specific tasks to support their teams, and we have received the following set of requirements for this use case:
- All the focus for the Sales Opps analysts will be around the current quarter, so we need the application to open with a particular set of selections.
- An application that has visual cues on the order processing requirements for each sales representative as well as detailed information about specific deal transactions.
- Some users have unique ways of performing their analysis, and they need to have alternatives when customizing visualizations to reduce time to act.
- We also need to provide extra details based on particular types of orders.
- The analysts are spread across different regions and use different devices for the analysis, we need the application to support this.
A dashboard developer, with knowledge of both QlikView and Qlik Sense, will most likely think that only QlikView can meet the majority of the requirements listed above. However, let's check how some of the new Qlik Sense capabilities can help to solve this business case and give the flexibility for self-service data exploration.
After loading and validating the data, we can start creating the visualizations to capture the insights. To address the need to start the application with a set of selections, we can define a default bookmark for the app. Every time a user now opens the application the selections contained in the bookmark will be applied.
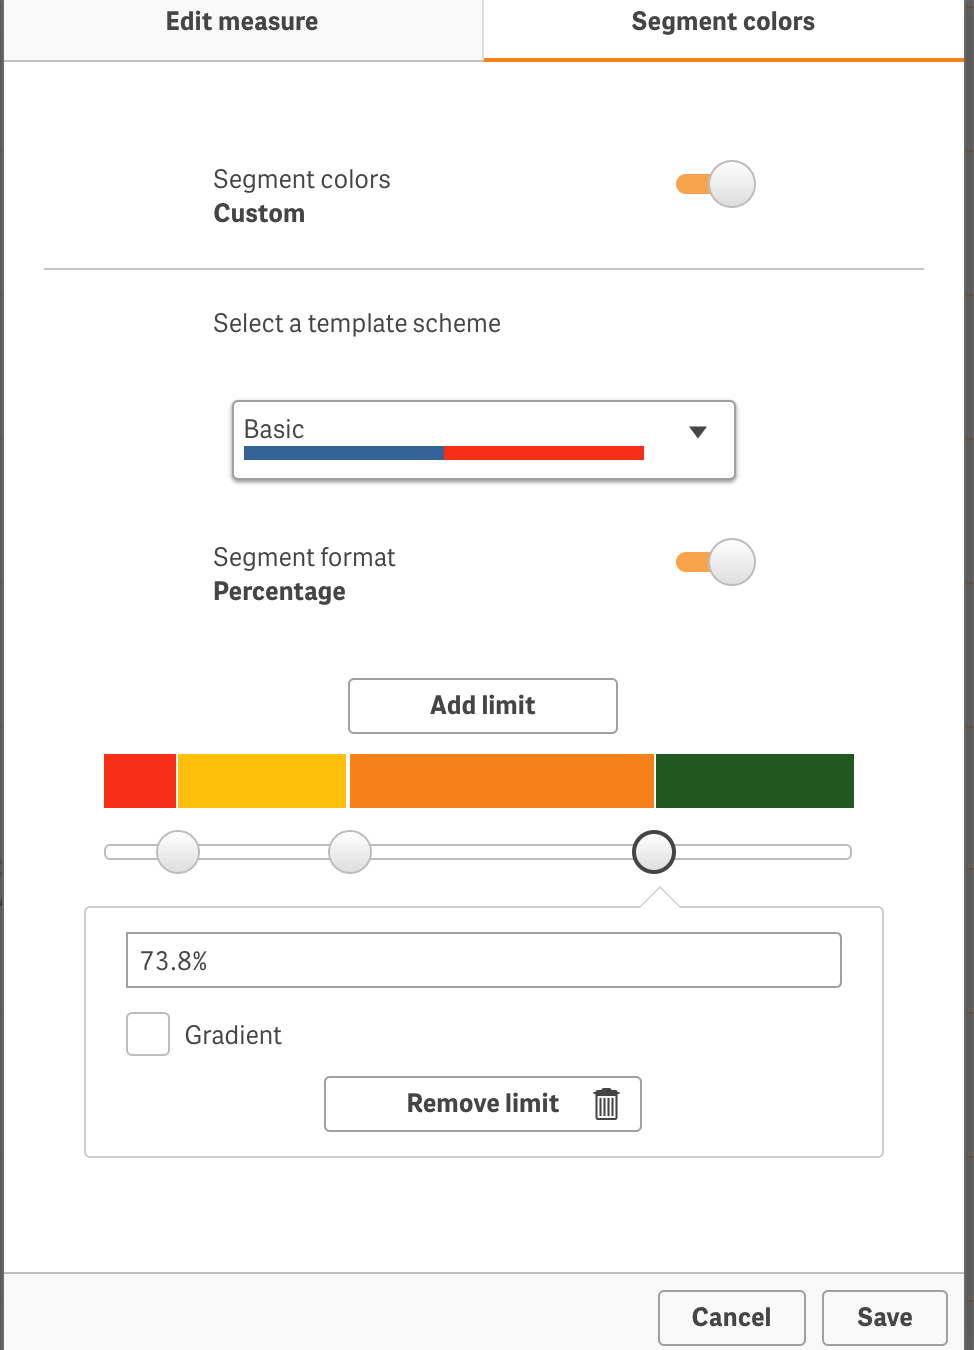
We need to highlight sales reps by the number of deals that require a manual order processing. There are 3 segments used to rank sales reps that need proactive support to speed up the ordering processing. Multiple visualizations require using the segments for highlighting the sales reps. To achieve this, we can create a measure in the Master Items and add a segment coloring configuration, which allows for multiple charts to use the same measure.
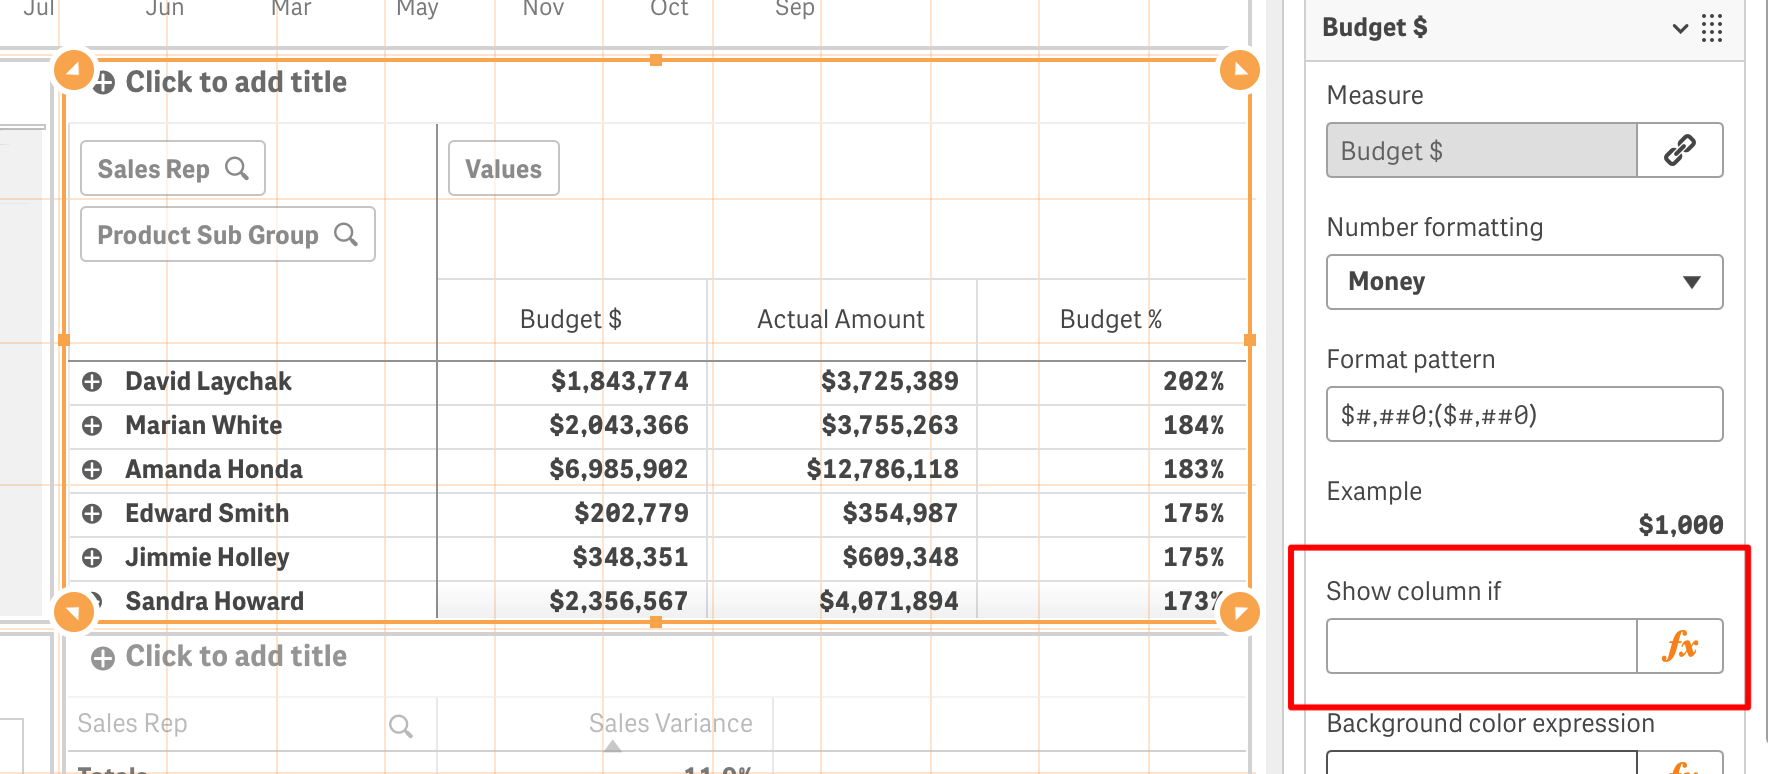
For the detailed transaction analysis, we need to create a pivot table to display the information about the order processing and it needs to have extra information in cases that require manual processing. There are many transactions and this can be confusing for the analysts. To simplify, we can add a calculation condition for the pivot table to prevent it from displaying multiple transactions in addition to a column with the extra manual processing required information in case the transaction has a manual process flag. To do this, we can add a show condition expression, making the column available only when meeting the criteria.
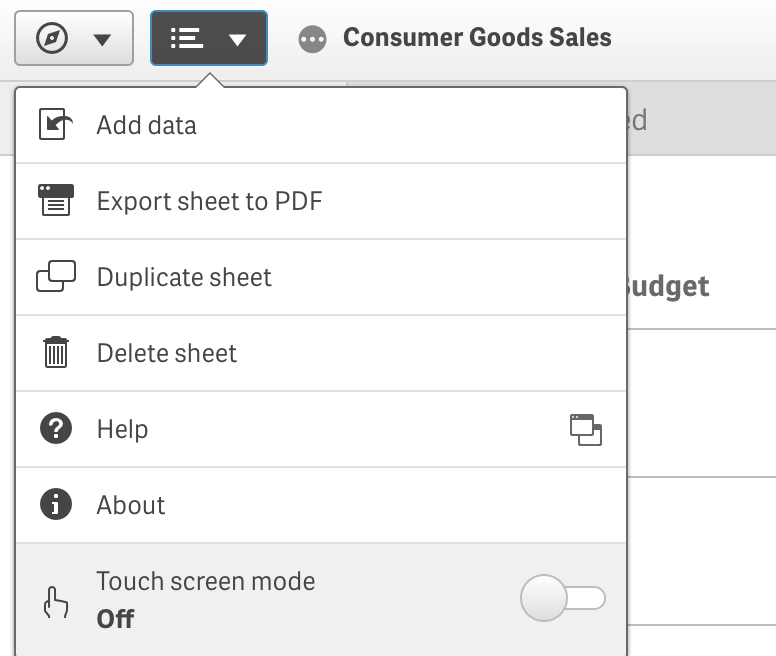
To address the requirement around supporting the use of different device types for analysts varying from traditional desktop computers, laptops or mobile devices, the information density on the client can be adjusted by enabling the touch screen mode. This makes the actions performed on the client more suitable for a finger interaction. For example, an adjusted row height in a pivot table.
Developing a Qlik Sense application could require different preparation steps and the need for a broader toolset available to developers. That is one of the advantages of Qlik Sense's flexibility to adapt to various use cases.
We have initiated a continued delivery of improvements for Qlik Sense focused on Advanced Authoring. You can read about what was delivered in the first wave of Advanced Authoring enhancements in the Qlik Sense June 2018 release “Advanced Authoring” capabilities in Qlik Sense!
The Qlik Sense September 2018 release brings the second wave of these improvements, to support developers who need their applications to perform specific tasks. The second wave of Advanced Authoring capabilities empowers developers to create applications to solve specific use cases and provides an improved set of tools to make their tasks more manageable and automated.
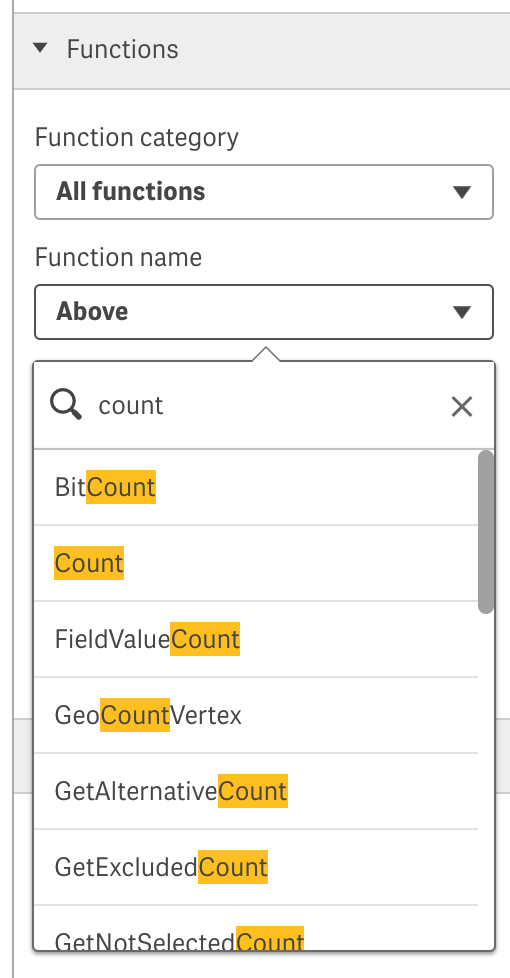
In addition to the requirements included in the “day in the life’ use case, the September 2018 release also delivers improvements to the experience when creating the expressions for measures, such as the ability to search in all sections of the Expression Editor dialog as well as getting a hyperlink directly to the Qlik Sense Help page for a particular function. We have also introduced the custom sheet size to allow developers to specify the size of the sheet in pixels and turn off the responsive design, giving the dashboard developer the choice of how a sheet behaves on different devices.
We would love to hear your feedback on how you plan to leverage these capabilities! Please visit our Qlik Sense Advanced Authoring space here on Qlik Community to have a dialog with Qlik Product Management on this high value focus area.
You must be a registered user to add a comment. If you've already registered, sign in. Otherwise, register and sign in.