Unlock a world of possibilities! Login now and discover the exclusive benefits awaiting you.
- Qlik Community
- :
- Forums
- :
- Groups
- :
- Industry and Topics
- :
- Scalability
- :
- Re: QV Scalability Tools (QV10,QV11,QV12)
- Subscribe to RSS Feed
- Mark Topic as New
- Mark Topic as Read
- Float this Topic for Current User
- Bookmark
- Subscribe
- Mute
- Printer Friendly Page
- Feature this Topic
- Mark as New
- Bookmark
- Subscribe
- Mute
- Subscribe to RSS Feed
- Permalink
- Report Inappropriate Content
QV Scalability Tools (QV10,QV11,QV12)
This package (referred to as QVScalabilityTools) contains a complete set of tools for easy creation, execution and analyzing of load/performance tests and regression tests.
QlikView documents to help analyze result and log files(This was previously included in this package):Scalability Results Analyzer
Older versions of the tool can be found here: Tool for easy creation of load/performance tests of QlikView (v.10 and 11)
Tools for Qlik Sense can be found here: Qlik Sense Scalability Tools
Note: Using windows built-in unzip functionality will not allow the .exe to launch unless unblocking zipped package first (properties -> unblock).
Note: Regarding Apache Log4j, reference CVE-2021-44228 (also referred to as Log4Shell), these set of tools are not directly vulnerable to the exploit, however JMeter, the tool required as a separate download, is. How to mitigate the vulnerability for JMeter has been documented here : https://community.qlik.com/t5/Knowledge/Qlik-Scalability-tools-and-log4j/ta-p/1872009
Included parts are:
- Standalone application for creating a JMeter script
- Support files for launching the script by utilizing the JMeter engine (JMeter installed is a pre-requisite)
- Documentation on how to use the package
Version 1.2.7->1.2.8
- Changes Section Access requests
Changelog 1.2.6->1.2.7
- NTLM support removed due current solution broken and lack of a new secure solution.
- Small updates for static content, for future product releases.
2019-08-26
Documentation updates due to:
- New recommended JMeter version (4.0)
- Changes to the licensing for the Oracle Java implementation (seehttps://www.oracle.com/technetwork/java/javase/overview/oracle-jdk-faqs.html)
- Open-source Java Development Kits (JDKs) have been verified for use with JMeter and the QlikView Scalability Tools
Changelog 1.2.5->1.2.6
- Added support for QlikView 12.50 and 12.20SR10
Changelog 1.2.4->1.2.5
- Added support for QlikView 12.30
Changelog 1.2.3->1.2.4
- Added support for JMeter 4.0 and Java 9.
- Bugfixes for regression testing
- Added actions: Select Excluded, Select All, Select Possible
- Added support for 12.20 SR3
Changelog 1.2.2->1.2.3
- Bugfix for export to excel action
- Added transfer state (bookmark) support for document chaining
- GUI: Template selection more accurately show supported Qv versions
Changelog 1.2.1->1.2.2
- Bugfixes, make sure minimum amount of selections are respected in certain corner cases
Changelog 1.2->1.2.1
- Improved performance for high throughput scenarios
Changelog 1.1 -> 1.2
- Improved assertions logic to show faulty actions as errors
- Change JMeter template scripts to use groovy instead of beanshell
- New prerequisites:
- JMeter version 3.0
- Java 64-bit JRE 8
Your use of QVScalabilityTools will be subject to the same license agreement between you and QlikTech for QlikView Server. QlikTech does not provide maintenance and support services for QVScalabilityTools, however please check QlikCommunity for additional information on use of these products.
PLEASE NOTE:
The supported versions of Java are 8 and 9. Supported version of JMeter are 3.0 and 4.0, but not 3.2
- Mark as New
- Bookmark
- Subscribe
- Mute
- Subscribe to RSS Feed
- Permalink
- Report Inappropriate Content
Hallo,
I try to load the Layout file and get the following error:
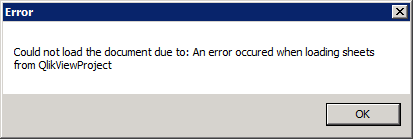
2014-07-29 10:10:43;SelectActionsUserControl::LoadDocument;qv.Parser.Xml.QlikViewDocumentXmlParseException: An error occured when loading sheets from QlikViewProject
at qv.Parser.Xml.QlikViewDocumentXmlParserV11SR1.Load(String directoryPathToTopLayout)
at qv.Parser.QlikViewDocumentParserFactory.Create(String documentFolderPath)
at qv.UserControls.SelectActionsWPFUserControl.LoadDocument()
I use Qlikview 11.2 SR7. I didn't have a clue what cause this issue.
How can I solve this problem?
Thanks for help
Bastian
- Mark as New
- Bookmark
- Subscribe
- Mute
- Subscribe to RSS Feed
- Permalink
- Report Inappropriate Content
The above is caused by percent an encoded character in the exported Document Layout files, in this case a "." which will be encoded as "%2E".
If this is encountered, check the folder where the document layout was exported and revert the percent encoding to the characters they should represent (see Percent-encoding - Wikipedia, the free encyclopedia) . The document layout files should be able to be read into the scalability tools after this.
- Mark as New
- Bookmark
- Subscribe
- Mute
- Subscribe to RSS Feed
- Permalink
- Report Inappropriate Content
Hi All,
I am using the QV Scalability tool for the first time.
We have SSO for our QlikView Server.
The QlikView Web server has Header authentication.
Can anybody suggest, how I can configure the Header field in the QlikView scalability tool.
I understand the login credentials go in to the usrpwd.txt file.
thanks,
Rajesh Vaswani
- Mark as New
- Bookmark
- Subscribe
- Mute
- Subscribe to RSS Feed
- Permalink
- Report Inappropriate Content
Rajesh,
On the Properties tab of the Scalability Tool, on the bottom of the page is a section called 'Authentication'. In the lower left you can select "Header" to enable header authentication.
- Mark as New
- Bookmark
- Subscribe
- Mute
- Subscribe to RSS Feed
- Permalink
- Report Inappropriate Content
Thanks Terry,
That worked.
regards,
Rajesh Vaswani
- Mark as New
- Bookmark
- Subscribe
- Mute
- Subscribe to RSS Feed
- Permalink
- Report Inappropriate Content
Hi All,
Using the QV Scalability tool, can we get the load times of the chart object?
We would like to measure the chart calculation time(time taken for an expression to execute).
thanks,
Rajesh Vaswani
- Mark as New
- Bookmark
- Subscribe
- Mute
- Subscribe to RSS Feed
- Permalink
- Report Inappropriate Content
The tool will measure the response time for all the objects on a sheet. To find the time for a single object, using the tool, the easiest way is to put it on a separate sheet. Thus the response time would correspond to that object. Do note that this would include network latency etc since it's a simulation.
There's also an option in QV to see calc time for objects. Right-click the tab, choose sheet properties. This is a good approximation of the calculation time, but obviously is highly dependent on if the object is cached etc (will show a very low value when cached, even down to 0),
Using a combination of both these methods should give a good picture of the calculation time. However during development using normal windows task manager, is probably the fastest way to get feedback on the performance of your chart/expression.
- Mark as New
- Bookmark
- Subscribe
- Mute
- Subscribe to RSS Feed
- Permalink
- Report Inappropriate Content
Hi Daniel,
Thanks for the three methods you have suggested.
Last question, If I were to say put a chart object (the more time consuming) in separate sheet.
Would the response time be derived condition to the chart has completely loaded?
thanks,
Rajesh Vaswani
- Mark as New
- Bookmark
- Subscribe
- Mute
- Subscribe to RSS Feed
- Permalink
- Report Inappropriate Content
The response will include all factors for response time, e.g. rendering time, network latency etc. These are however negligible and the expression would be the bigger factor. It is still dependent och cache however and time will be faster once it's cached. To make sure to always have the same conditions the engine service should be restarted before a simulation is started.
- Mark as New
- Bookmark
- Subscribe
- Mute
- Subscribe to RSS Feed
- Permalink
- Report Inappropriate Content
Thank you somuch Daniel, that helps.
regards,
Rajesh Vaswani