Unlock a world of possibilities! Login now and discover the exclusive benefits awaiting you.
- Qlik Community
- :
- Forums
- :
- Groups
- :
- Industry and Topics
- :
- Scalability
- :
- QV Scalability Tools (QV10,QV11,QV12)
- Subscribe to RSS Feed
- Mark Topic as New
- Mark Topic as Read
- Float this Topic for Current User
- Bookmark
- Subscribe
- Mute
- Printer Friendly Page
- Feature this Topic
- Mark as New
- Bookmark
- Subscribe
- Mute
- Subscribe to RSS Feed
- Permalink
- Report Inappropriate Content
QV Scalability Tools (QV10,QV11,QV12)
This package (referred to as QVScalabilityTools) contains a complete set of tools for easy creation, execution and analyzing of load/performance tests and regression tests.
QlikView documents to help analyze result and log files(This was previously included in this package):Scalability Results Analyzer
Older versions of the tool can be found here: Tool for easy creation of load/performance tests of QlikView (v.10 and 11)
Tools for Qlik Sense can be found here: Qlik Sense Scalability Tools
Note: Using windows built-in unzip functionality will not allow the .exe to launch unless unblocking zipped package first (properties -> unblock).
Note: Regarding Apache Log4j, reference CVE-2021-44228 (also referred to as Log4Shell), these set of tools are not directly vulnerable to the exploit, however JMeter, the tool required as a separate download, is. How to mitigate the vulnerability for JMeter has been documented here : https://community.qlik.com/t5/Knowledge/Qlik-Scalability-tools-and-log4j/ta-p/1872009
Included parts are:
- Standalone application for creating a JMeter script
- Support files for launching the script by utilizing the JMeter engine (JMeter installed is a pre-requisite)
- Documentation on how to use the package
Version 1.2.7->1.2.8
- Changes Section Access requests
Changelog 1.2.6->1.2.7
- NTLM support removed due current solution broken and lack of a new secure solution.
- Small updates for static content, for future product releases.
2019-08-26
Documentation updates due to:
- New recommended JMeter version (4.0)
- Changes to the licensing for the Oracle Java implementation (seehttps://www.oracle.com/technetwork/java/javase/overview/oracle-jdk-faqs.html)
- Open-source Java Development Kits (JDKs) have been verified for use with JMeter and the QlikView Scalability Tools
Changelog 1.2.5->1.2.6
- Added support for QlikView 12.50 and 12.20SR10
Changelog 1.2.4->1.2.5
- Added support for QlikView 12.30
Changelog 1.2.3->1.2.4
- Added support for JMeter 4.0 and Java 9.
- Bugfixes for regression testing
- Added actions: Select Excluded, Select All, Select Possible
- Added support for 12.20 SR3
Changelog 1.2.2->1.2.3
- Bugfix for export to excel action
- Added transfer state (bookmark) support for document chaining
- GUI: Template selection more accurately show supported Qv versions
Changelog 1.2.1->1.2.2
- Bugfixes, make sure minimum amount of selections are respected in certain corner cases
Changelog 1.2->1.2.1
- Improved performance for high throughput scenarios
Changelog 1.1 -> 1.2
- Improved assertions logic to show faulty actions as errors
- Change JMeter template scripts to use groovy instead of beanshell
- New prerequisites:
- JMeter version 3.0
- Java 64-bit JRE 8
Your use of QVScalabilityTools will be subject to the same license agreement between you and QlikTech for QlikView Server. QlikTech does not provide maintenance and support services for QVScalabilityTools, however please check QlikCommunity for additional information on use of these products.
PLEASE NOTE:
The supported versions of Java are 8 and 9. Supported version of JMeter are 3.0 and 4.0, but not 3.2
- Mark as New
- Bookmark
- Subscribe
- Mute
- Subscribe to RSS Feed
- Permalink
- Report Inappropriate Content
Hi All,
The open document time shows double the open time via JMeter than when I do it manually.
Does anyone have any inputs on this?
thanks,
Rajesh Vaswani
- Mark as New
- Bookmark
- Subscribe
- Mute
- Subscribe to RSS Feed
- Permalink
- Report Inappropriate Content
Hi Rajesh,
The time in jmeter will be the total time until all objects on that sheet are finished. By looking at this manually it is possible that the page appears fully loaded eventhough calculations for some objects are still ongoing in the background - that is one possible outcome why you see different results. As such, jmeter can give a worse picture than what is really the user percieved performance.
Another I can think of is that the tool actually opens a different default sheet to what is opened by default manually. That can happen if the document has been saved on a different sheets inbetween the tests. It can also happen if session recovery is turned on (which it should not be when load tetsing).
Regards
/Sebastian
- Mark as New
- Bookmark
- Subscribe
- Mute
- Subscribe to RSS Feed
- Permalink
- Report Inappropriate Content
Another option for seeing Object Calc times is
QV Document Analyzer http://qlikviewcookbook.com/recipes/download-info/document-analyzer/
DocAnalyzer visits every object and then uses the timing data produced by the .mem file.
-Rob
- Mark as New
- Bookmark
- Subscribe
- Mute
- Subscribe to RSS Feed
- Permalink
- Report Inappropriate Content
Hi All,
I am setting up a Data Collector as per the prerequisites for the Scalability Tool.
While creating the new data collector set, the document mentions to browse for Processes_template.xml
On the server where I am setting up the Data Collector. I do not find this XML file. Am I missing something?
thanks,
Rajesh Vaswani
- Mark as New
- Bookmark
- Subscribe
- Mute
- Subscribe to RSS Feed
- Permalink
- Report Inappropriate Content
Hi Rajesh,
The template file is included in the sclability tool package, next to the documentation files.
- Mark as New
- Bookmark
- Subscribe
- Mute
- Subscribe to RSS Feed
- Permalink
- Report Inappropriate Content
Thanks Sebastian,
Thanks for your reply.
Got it, I got his file to the server. It says that the file specified does not contain a valid XML.
Is there any change that needs to be done to this XML file?
regards,
Rajesh Vaswani
- Mark as New
- Bookmark
- Subscribe
- Mute
- Subscribe to RSS Feed
- Permalink
- Report Inappropriate Content
Hi All,
What browser is used in the background?
My Guess is no browser, its just HTTP requests and responses.
thanks,
Rajesh Vaswani
- Mark as New
- Bookmark
- Subscribe
- Mute
- Subscribe to RSS Feed
- Permalink
- Report Inappropriate Content
Hi All,
Have set up the Scalability Tool and am reading the response form the dashboard.
The JMeter log gives a success with Response 200 as well as an error for every action
The Error from the JMeter log is as below.
| timeStamp | elapsed | label | responseCode | responseMessage | threadName | dataType | success | bytes | grpThreads | allThreads | Latency |
| 1.41E+12 | 29515 | Access Point #1 | Number of samples in transaction : 22, number of failing samples : 2 | QlikView 1-1 | FALSE | 268237 | 1 | 1 | 16312 | ||
Could someone suggest as to what can be causing this?
thanks,
Rajesh Vaswani
- Mark as New
- Bookmark
- Subscribe
- Mute
- Subscribe to RSS Feed
- Permalink
- Report Inappropriate Content
Hi Rajesh,
1. Regarding the Performance counter file, I just tried on my laptop with Win7 and it works for me. My best guess would be that the the was not unzipped, but rather moved from the zip but even that is fine for me so it is strange. To clarify, you need the "Processes_template.xml" stored within the package, and it is best setup by going to performance monitor > Data Collector Set > User Defined. Select Action > New > Data Collector set and then import that xml file (from a template option).
2. You are right about jmeter, no browser involved like there are in some test tools. It's generating http/https requests/responses.
3. For the error, I suspect authentication issues but hard to tell without more information. I suggest that you run the script with only one user from within the jmeter GUI and observe the requests and responses, it will give you more information. The way to do this, assuming you are using the Scalability Tool GUI and have your script file in the Execution tab:
1. Preferably set the concurrent users to 1 (easier to troubleshoot)
2. Right click on the script file > select open in jmeter.
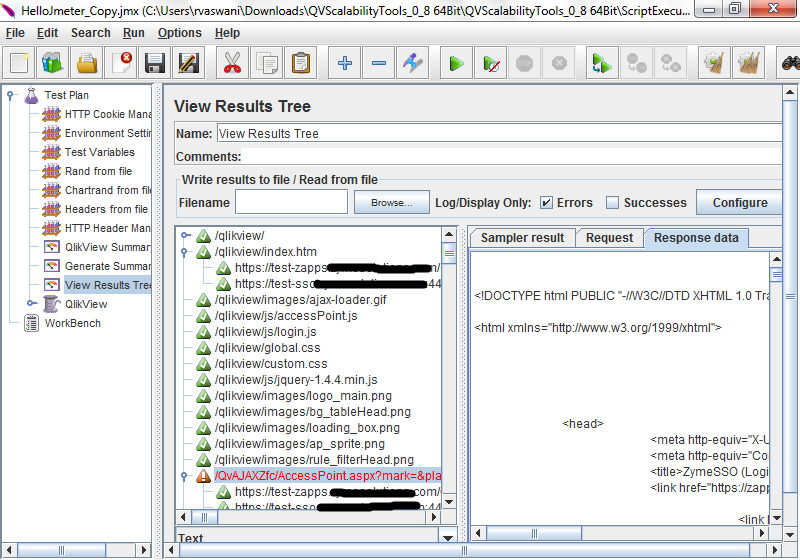
3. Once jmeter have started, find the greyed out component called "View Results Tree". Right click on that and enable it.
4. Run the test, using the green play button or "ctrl+r".
5. Check results by selecting the view results tree and select the red requests. Then switch to response tabe to see the response.
I hope that can give som clarity
Sebastian
- Mark as New
- Bookmark
- Subscribe
- Mute
- Subscribe to RSS Feed
- Permalink
- Report Inappropriate Content
Hi Sebastian,
Thanks for your reply. I am able to open Jmeter and see the responses as suggested by you. The responses HTML when I take and show for each of the response. I end up seeing a login page. Attaching the screenshot of request and responses. I have an SSO, have entered the header name as well as the username password in the text file. Could you please suggest as to what could be failing? I have a fail for every test.
The log looks as follows
timeStamp,elapsed,label,responseCode,responseMessage,threadName,dataType,success,bytes,grpThreads,allThreads,Latency
1410168686466,4552,/qlikview/,200,OK,QlikView 1-1,text,true,10686,1,1,2254
1410168691029,2147,/qlikview/index.htm,200,OK,QlikView 1-1,text,true,10620,1,1,1017
1410168693183,1374,/qlikview/images/ajax-loader.gif,200,OK,QlikView 1-1,bin,true,11183,1,1,748
1410168694567,1661,/qlikview/js/accessPoint.js,200,OK,QlikView 1-1,text,true,40060,1,1,723
1410168696235,837,/qlikview/js/login.js,200,OK,QlikView 1-1,text,true,5082,1,1,835
1410168697077,991,/qlikview/global.css,200,OK,QlikView 1-1,text,true,19260,1,1,674
1410168698071,654,/qlikview/custom.css,200,OK,QlikView 1-1,text,true,718,1,1,654
1410168698728,2194,/qlikview/js/jquery-1.4.4.min.js,200,OK,QlikView 1-1,text,true,78971,1,1,706
1410168700925,964,/qlikview/images/logo_main.png,200,OK,QlikView 1-1,bin,true,6760,1,1,841
1410168701896,1162,/qlikview/images/bg_tableHead.png,200,OK,QlikView 1-1,bin,true,5530,1,1,658
1410168703062,966,/qlikview/images/loading_box.png,200,OK,QlikView 1-1,bin,true,6444,1,1,795
1410168704031,1218,/qlikview/images/ap_sprite.png,200,OK,QlikView 1-1,bin,true,8833,1,1,870
1410168705251,989,/qlikview/images/rule_filterHead.png,200,OK,QlikView 1-1,bin,true,3931,1,1,797
1410168706251,3153,/QvAJAXZfc/AccessPoint.aspx?mark=&platform=browser.gecko.5&dpi=96,200,OK,QlikView 1-1,text,false,10881,1,1,852
1410168709553,978,/qlikview/images/logo_accessPoint.png,200,OK,QlikView 1-1,bin,true,2416,1,1,978
1410168710535,958,/qlikview/images/rule_columnHead.png,200,OK,QlikView 1-1,bin,true,3906,1,1,738
1410168711496,967,/qlikview/images/bg_columnHead_off.png,200,OK,QlikView 1-1,bin,true,3906,1,1,660
1410168712466,1163,/qlikview/images/bg_body.png,200,OK,QlikView 1-1,bin,true,4980,1,1,671
1410168713632,3061,/QvAJAXZfc/Authenticate.aspx,200,OK,QlikView 1-1,text,true,10667,1,1,968
1410168716694,1995,/QvAJAXZfc/AccessPoint.aspx?mark=&platform=browser.gecko.5&dpi=96,200,OK,QlikView 1-1,text,false,10877,1,1,933
1410168718701,714,/qlikview/images/bg_thumb.png,200,OK,QlikView 1-1,bin,true,1392,1,1,714
1410168719448,2068,/QvAJAXZfc/AccessPoint.aspx,200,OK,QlikView 1-1,text,true,11124,1,1,692
1410168686463,35053,Access Point #1,,"Number of samples in transaction : 22, number of failing samples : 2",QlikView 1-1,,false,268227,1,1,18778
1410168721549,1940,/QvAjaxZfc/AccessPoint.aspx,200,OK,QlikView 1-1,text,true,10965,1,1,577
1410168723493,2190,/QvAjaxZfc/opendoc.htm,200,OK,QlikView 1-1,text,true,10893,1,1,931
1410168725687,1517,/QvAjaxZfc/htc/default.css,200,OK,QlikView 1-1,text,true,23042,1,1,730
1410168727206,2013,/QvAjaxZfc/htc/QvAjax.js,200,OK,QlikView 1-1,text,true,10656,1,1,852
1410168729223,2243,/QvAjaxZfc/Authenticate.aspx,200,OK,QlikView 1-1,text,true,10705,1,1,1058
1410168731469,1953,/QvAjaxZfc/htc/images/property_sprite.png,200,OK,QlikView 1-1,bin,true,77112,1,1,818
1410168733441,2373,Open Doc Request,200,OK,QlikView 1-1,text,false,11251,1,1,903
1410168735865,1516,/QvAjaxZfc/QvsViewClient.aspx,200,OK,QlikView 1-1,text,true,11085,1,1,514
1410168737535,2144,Poll,200,OK,QlikView 1-1,text,true,11280,1,1,789
1410168739731,1933,/QvAJAXZfc/QvsViewClient.aspx?mark=no_match&host=Stripe&view=ZAP_UAT/ZAP_Global_Dev.qvw&platform=browser.gecko.3.6&dpi=96&xrfkey=xrfkeyvalue12345,200,OK,QlikView 1-1,text,true,11280,1,1,681
1410168741676,2079,/QvAjaxZfc/QvsViewClient.aspx,200,OK,QlikView 1-1,text,true,10991,1,1,855
1410168743759,2292,/QvAjaxZfc/QvsViewClient.aspx,200,OK,QlikView 1-1,text,true,10981,1,1,885
1410168746054,1782,/QvAjaxZfc/QvsViewClient.aspx,200,OK,QlikView 1-1,text,true,11010,1,1,932
1410168747840,2429,/QvAjaxZfc/QvsViewClient.aspx,200,OK,QlikView 1-1,text,true,11036,1,1,920
1410168750273,1710,/QvAjaxZfc/QvsViewClient.aspx,200,OK,QlikView 1-1,text,true,10981,1,1,856
1410168751986,2156,/QvAjaxZfc/QvsViewClient.aspx,200,OK,QlikView 1-1,text,true,10958,1,1,953
1410168754145,2459,/QvAjaxZfc/QvsViewClient.aspx,200,OK,QlikView 1-1,text,true,10994,1,1,988
1410168756611,2626,/QvAjaxZfc/QvsViewClient.aspx,200,OK,QlikView 1-1,text,true,10991,1,1,1336
1410168759241,1641,/QvAjaxZfc/QvsViewClient.aspx,200,OK,QlikView 1-1,text,true,10981,1,1,701
1410168760887,2084,/QvAjaxZfc/QvsViewClient.aspx,200,OK,QlikView 1-1,text,true,10968,1,1,930
1410168762974,2608,/QvAjaxZfc/QvsViewClient.aspx,200,OK,QlikView 1-1,text,true,10939,1,1,1037
1410168765585,2135,/QvAjaxZfc/QvsViewClient.aspx,200,OK,QlikView 1-1,text,true,10942,1,1,932
1410168767723,2344,/QvAjaxZfc/QvsViewClient.aspx,200,OK,QlikView 1-1,text,true,10945,1,1,891
1410168770070,2301,/QvAjaxZfc/QvsViewClient.aspx,200,OK,QlikView 1-1,text,true,10994,1,1,937
1410168772374,2661,/QvAjaxZfc/QvsViewClient.aspx,200,OK,QlikView 1-1,text,true,10978,1,1,934
1410168775038,2340,/QvAjaxZfc/QvsViewClient.aspx,200,OK,QlikView 1-1,text,true,10952,1,1,875
1410168777381,2260,/QvAjaxZfc/QvsViewClient.aspx,200,OK,QlikView 1-1,text,true,10952,1,1,938
1410168779644,2326,/QvAjaxZfc/QvsViewClient.aspx,200,OK,QlikView 1-1,text,true,11046,1,1,972
1410168781974,2608,/QvAjaxZfc/QvsViewClient.aspx,200,OK,QlikView 1-1,text,true,11075,1,1,934
1410168784585,2868,/QvAjaxZfc/QvsViewClient.aspx,200,OK,QlikView 1-1,text,true,11098,1,1,1040
1410168787456,2797,/QvAjaxZfc/QvsViewClient.aspx,200,OK,QlikView 1-1,text,true,11085,1,1,993
1410168790256,2199,/QvAjaxZfc/QvsViewClient.aspx,200,OK,QlikView 1-1,text,true,10981,1,1,860
1410168792459,8,Remove CHNAMESTEMP variables,200,OK,QlikView 1-1,text,true,0,1,1,0
1410168792474,1,qlikmachineid:${COOKIE_qlikmachineid}|teal_Dev.qvw|1,200,OK,QlikView 1-1,text,true,0,1,1,0
1410168721530,70956,Open Document #2,,"Number of samples in transaction : 38, number of failing samples : 1",QlikView 1-1,,false,430147,1,1,28552
1410168822447,2,BeanShell Sampler GaussianTimer,200,OK,QlikView 1-1,text,true,0,1,1,0
1410168792496,29955,"Timer Delay - GaussianTimer [30000,2000] #3",200,"Number of samples in transaction : 1, number of failing samples : 0",QlikView 1-1,,true,0,1,1,0
1410168822465,4514,Change sheet Request,200,OK,QlikView 1-1,text,false,11282,1,1,1915
1410168827143,1522,Poll,200,OK,QlikView 1-1,text,true,11280,1,1,690
1410168828709,2,Remove CHNAMESTEMP variables,200,OK,QlikView 1-1,text,true,0,1,1,0
1410168822463,6251,Top Segments #4,,"Number of samples in transaction : 6, number of failing samples : 1",QlikView 1-1,,false,22562,1,1,2605
1410168861856,1,BeanShell Sampler GaussianTimer,200,OK,QlikView 1-1,text,true,0,1,1,0
1410168828718,33141,"Timer Delay - GaussianTimer [30000,2000] #5",200,"Number of samples in transaction : 1, number of failing samples : 0",QlikView 1-1,,true,0,1,1,0
1410168861873,189051,Clear all Request,Non HTTP response code: javax.net.ssl.SSLHandshakeException,Non HTTP response message: Remote host closed connection during handshake,QlikView 1-1,text,false,1304,1,1,0
1410169051109,5332,Poll,200,OK,QlikView 1-1,text,true,11282,1,1,2373
1410169056497,2,Remove CHNAMESTEMP variables,200,OK,QlikView 1-1,text,true,0,1,1,0
1410168861872,194631,Clear All #6,,"Number of samples in transaction : 6, number of failing samples : 1",QlikView 1-1,,false,12586,1,1,2373
1410169056508,1503,Change sheet Request,200,OK,QlikView 1-1,text,false,11283,1,1,409
1410169058197,1695,Poll,200,OK,QlikView 1-1,text,true,11283,1,1,443
1410169059932,2,Remove CHNAMESTEMP variables,200,OK,QlikView 1-1,text,true,0,1,1,0
1410169056506,3431,POS-Browser #7,,"Number of samples in transaction : 6, number of failing samples : 1",QlikView 1-1,,false,22566,1,1,852
1410169092110,0,BeanShell Sampler UniformTimer,200,OK,QlikView 1-1,text,true,0,1,1,0
1410169059940,32173,"Timer Delay - UniformTimer [30000,5000] #8",200,"Number of samples in transaction : 1, number of failing samples : 0",QlikView 1-1,,true,0,1,1,0
1410169092127,4417,Clear all Request,200,OK,QlikView 1-1,text,false,11285,1,1,2352
1410169096731,1000,Poll,200,OK,QlikView 1-1,text,true,11280,1,1,323
1410169097766,2,Remove CHNAMESTEMP variables,200,OK,QlikView 1-1,text,true,0,1,1,0
1410169092126,5644,Clear All #9,,"Number of samples in transaction : 6, number of failing samples : 1",QlikView 1-1,,false,22565,1,1,2675
1410169129953,0,BeanShell Sampler UniformTimer,200,OK,QlikView 1-1,text,true,0,1,1,0
1410169097774,32180,"Timer Delay - UniformTimer [30000,5000] #10",200,"Number of samples in transaction : 1, number of failing samples : 0",QlikView 1-1,,true,0,1,1,0
1410169129960,5948,Change sheet Request,200,OK,QlikView 1-1,text,false,11282,1,1,2758
1410169136097,1723,Poll,200,OK,QlikView 1-1,text,true,11280,1,1,470
1410169137871,5,Remove CHNAMESTEMP variables,200,OK,QlikView 1-1,text,true,0,1,1,0
1410169129958,7928,POS - Trends #11,,"Number of samples in transaction : 6, number of failing samples : 1",QlikView 1-1,,false,22562,1,1,3228
1410169171543,1,BeanShell Sampler UniformTimer,200,OK,QlikView 1-1,text,true,0,1,1,0
1410169137896,33650,"Timer Delay - UniformTimer [30000,5000] #12",200,"Number of samples in transaction : 1, number of failing samples : 0",QlikView 1-1,,true,0,1,1,0
1410169171560,3933,Clear all Request,200,OK,QlikView 1-1,text,false,11285,1,1,1904
1410169175680,1515,Poll,200,OK,QlikView 1-1,text,true,11280,1,1,340
1410169177227,25,Remove CHNAMESTEMP variables,200,OK,QlikView 1-1,text,true,0,1,1,0
1410169171559,5701,Clear All #13,,"Number of samples in transaction : 6, number of failing samples : 1",QlikView 1-1,,false,22565,1,1,2244
1410169209589,1,BeanShell Sampler UniformTimer,200,OK,QlikView 1-1,text,true,0,1,1,0
1410169177264,32328,"Timer Delay - UniformTimer [30000,5000] #14",200,"Number of samples in transaction : 1, number of failing samples : 0",QlikView 1-1,,true,0,1,1,0
1410169209619,4012,Change sheet Request,200,OK,QlikView 1-1,text,false,11282,1,1,1939
1410169213820,1330,Poll,200,OK,QlikView 1-1,text,true,11280,1,1,349
1410169215192,7,Remove CHNAMESTEMP variables,200,OK,QlikView 1-1,text,true,0,1,1,0
1410169209606,5598,POS - Momentum #15,,"Number of samples in transaction : 6, number of failing samples : 1",QlikView 1-1,,false,22562,1,1,2288
1410169247001,1,BeanShell Sampler UniformTimer,200,OK,QlikView 1-1,text,true,0,1,1,0
1410169215207,31796,"Timer Delay - UniformTimer [30000,5000] #16",200,"Number of samples in transaction : 1, number of failing samples : 0",QlikView 1-1,,true,0,1,1,0
1410169247018,3985,Clear all Request,200,OK,QlikView 1-1,text,false,11282,1,1,1932
1410169251187,1729,Poll,200,OK,QlikView 1-1,text,true,11283,1,1,895
1410169252958,4,Remove CHNAMESTEMP variables,200,OK,QlikView 1-1,text,true,0,1,1,0
1410169247017,5953,Clear All #17,,"Number of samples in transaction : 6, number of failing samples : 1",QlikView 1-1,,false,22565,1,1,2827
1410169284728,1,BeanShell Sampler UniformTimer,200,OK,QlikView 1-1,text,true,0,1,1,0
1410169252974,31757,"Timer Delay - UniformTimer [30000,5000] #18",200,"Number of samples in transaction : 1, number of failing samples : 0",QlikView 1-1,,true,0,1,1,0
1410169284751,4380,Change sheet Request,200,OK,QlikView 1-1,text,false,11282,1,1,2217
1410169289302,1281,Poll,200,OK,QlikView 1-1,text,true,11283,1,1,411
1410169290619,1,Remove CHNAMESTEMP variables,200,OK,QlikView 1-1,text,true,0,1,1,0
1410169284743,5880,Returns Monitor #19,,"Number of samples in transaction : 6, number of failing samples : 1",QlikView 1-1,,false,22565,1,1,2628
1410169320920,0,BeanShell Sampler UniformTimer,200,OK,QlikView 1-1,text,true,0,1,1,0
1410169290626,30297,"Timer Delay - UniformTimer [30000,5000] #20",200,"Number of samples in transaction : 1, number of failing samples : 0",QlikView 1-1,,true,0,1,1,0
1410169320935,4127,Clear all Request,200,OK,QlikView 1-1,text,false,11282,1,1,2066
1410169325260,1422,Poll,200,OK,QlikView 1-1,text,true,11280,1,1,435
1410169326715,1,Remove CHNAMESTEMP variables,200,OK,QlikView 1-1,text,true,0,1,1,0
1410169320934,5783,Clear All #21,,"Number of samples in transaction : 6, number of failing samples : 1",QlikView 1-1,,false,22562,1,1,2501
1410169361109,0,BeanShell Sampler UniformTimer,200,OK,QlikView 1-1,text,true,0,1,1,0
1410169326720,34391,"Timer Delay - UniformTimer [30000,5000] #22",200,"Number of samples in transaction : 1, number of failing samples : 0",QlikView 1-1,,true,0,1,1,0
1410169361132,4794,Change sheet Request,200,OK,QlikView 1-1,text,false,11285,1,1,1822
1410169366115,1542,Poll,200,OK,QlikView 1-1,text,true,11280,1,1,362
1410169367668,5,Remove CHNAMESTEMP variables,200,OK,QlikView 1-1,text,true,0,1,1,0
1410169361124,6549,Market Monitor #23,,"Number of samples in transaction : 6, number of failing samples : 1",QlikView 1-1,,false,22565,1,1,2184
1410169399275,1,BeanShell Sampler UniformTimer,200,OK,QlikView 1-1,text,true,0,1,1,0
1410169367678,31600,"Timer Delay - UniformTimer [30000,5000] #24",200,"Number of samples in transaction : 1, number of failing samples : 0",QlikView 1-1,,true,0,1,1,0
1410169399290,4499,Clear all Request,200,OK,QlikView 1-1,text,false,11282,1,1,2460
1410169403969,1957,Poll,200,OK,QlikView 1-1,text,true,11280,1,1,916
1410169405937,1,Remove CHNAMESTEMP variables,200,OK,QlikView 1-1,text,true,0,1,1,0
1410169399289,6651,Clear All #25,,"Number of samples in transaction : 6, number of failing samples : 1",QlikView 1-1,,false,22562,1,1,3376
1410169440106,1,BeanShell Sampler UniformTimer,200,OK,QlikView 1-1,text,true,0,1,1,0
1410169405944,34165,"Timer Delay - UniformTimer [30000,5000] #26",200,"Number of samples in transaction : 1, number of failing samples : 0",QlikView 1-1,,true,0,1,1,0
1410169440129,4204,Change sheet Request,200,OK,QlikView 1-1,text,false,11285,1,1,1763
1410169444510,1673,Poll,200,OK,QlikView 1-1,text,true,11283,1,1,688
1410169446221,1,Remove CHNAMESTEMP variables,200,OK,QlikView 1-1,text,true,0,1,1,0
1410169440121,6102,POS- Map #27,,"Number of samples in transaction : 6, number of failing samples : 1",QlikView 1-1,,false,22568,1,1,2451
1410169479007,1,BeanShell Sampler UniformTimer,200,OK,QlikView 1-1,text,true,0,1,1,0
1410169446227,32783,"Timer Delay - UniformTimer [30000,5000] #28",200,"Number of samples in transaction : 1, number of failing samples : 0",QlikView 1-1,,true,0,1,1,0
1410169479023,4504,Clear all Request,200,OK,QlikView 1-1,text,false,11285,1,1,2018
1410169483708,1701,Poll,200,OK,QlikView 1-1,text,true,11280,1,1,345
1410169485455,2,Remove CHNAMESTEMP variables,200,OK,QlikView 1-1,text,true,0,1,1,0
1410169479023,6434,Clear All #29,,"Number of samples in transaction : 6, number of failing samples : 1",QlikView 1-1,,false,22565,1,1,2363
1410169518935,0,BeanShell Sampler UniformTimer,200,OK,QlikView 1-1,text,true,0,1,1,0
1410169485461,33476,"Timer Delay - UniformTimer [30000,5000] #30",200,"Number of samples in transaction : 1, number of failing samples : 0",QlikView 1-1,,true,0,1,1,0
1410169518957,4912,Change sheet Request,200,OK,QlikView 1-1,text,false,11285,1,1,2590
1410169524056,1743,Poll,200,OK,QlikView 1-1,text,true,11280,1,1,833
1410169525833,2,Remove CHNAMESTEMP variables,200,OK,QlikView 1-1,text,true,0,1,1,0
1410169518949,6889,Inventory Browser #31,,"Number of samples in transaction : 6, number of failing samples : 1",QlikView 1-1,,false,22565,1,1,3423
1410169559122,0,BeanShell Sampler UniformTimer,200,OK,QlikView 1-1,text,true,0,1,1,0
1410169525840,33284,"Timer Delay - UniformTimer [30000,5000] #32",200,"Number of samples in transaction : 1, number of failing samples : 0",QlikView 1-1,,true,0,1,1,0
1410169559144,4286,Change sheet Request,200,OK,QlikView 1-1,text,false,11285,1,1,1883
1410169563622,1022,Poll,200,OK,QlikView 1-1,text,true,11280,1,1,328
1410169564682,1,Remove CHNAMESTEMP variables,200,OK,QlikView 1-1,text,true,0,1,1,0
1410169559137,5546,Inventory Trends #33,,"Number of samples in transaction : 6, number of failing samples : 1",QlikView 1-1,,false,22565,1,1,2211
1410169595901,1,BeanShell Sampler UniformTimer,200,OK,QlikView 1-1,text,true,0,1,1,0
1410169564687,31217,"Timer Delay - UniformTimer [30000,5000] #34",200,"Number of samples in transaction : 1, number of failing samples : 0",QlikView 1-1,,true,0,1,1,0
1410169595918,4281,Clear all Request,200,OK,QlikView 1-1,text,false,11285,1,1,2185
1410169600386,1811,Poll,200,OK,QlikView 1-1,text,true,11283,1,1,851
1410169602251,1,Remove CHNAMESTEMP variables,200,OK,QlikView 1-1,text,true,0,1,1,0
1410169595917,6338,Clear All #35,,"Number of samples in transaction : 6, number of failing samples : 1",QlikView 1-1,,false,22568,1,1,3036
1410169633909,1,BeanShell Sampler UniformTimer,200,OK,QlikView 1-1,text,true,0,1,1,0
1410169602259,31653,"Timer Delay - UniformTimer [30000,5000] #36",200,"Number of samples in transaction : 1, number of failing samples : 0",QlikView 1-1,,true,0,1,1,0
1410169633932,3916,Change sheet Request,200,OK,QlikView 1-1,text,false,11285,1,1,1781
1410169638031,1365,Poll,200,OK,QlikView 1-1,text,true,11280,1,1,388
1410169639433,3,Remove CHNAMESTEMP variables,200,OK,QlikView 1-1,text,true,0,1,1,0
1410169633925,5513,Inventory Monitor #37,,"Number of samples in transaction : 6, number of failing samples : 1",QlikView 1-1,,false,22565,1,1,2169
1410169671336,1,BeanShell Sampler UniformTimer,200,OK,QlikView 1-1,text,true,0,1,1,0
1410169639441,31895,"Timer Delay - UniformTimer [30000,5000] #38",200,"Number of samples in transaction : 1, number of failing samples : 0",QlikView 1-1,,true,0,1,1,0
1410169671352,4323,Clear all Request,200,OK,QlikView 1-1,text,false,11285,1,1,1958
1410169675855,1731,Poll,200,OK,QlikView 1-1,text,true,11283,1,1,690
1410169677625,2,Remove CHNAMESTEMP variables,200,OK,QlikView 1-1,text,true,0,1,1,0
1410169671351,6278,Clear All #39,,"Number of samples in transaction : 6, number of failing samples : 1",QlikView 1-1,,false,22568,1,1,2648
1410169709018,1,BeanShell Sampler UniformTimer,200,OK,QlikView 1-1,text,true,0,1,1,0
1410169677632,31385,"Timer Delay - UniformTimer [30000,5000] #40",200,"Number of samples in transaction : 1, number of failing samples : 0",QlikView 1-1,,true,0,1,1,0
1410169709038,4273,Change sheet Request,200,OK,QlikView 1-1,text,false,11285,1,1,1976
1410169713502,1894,Poll,200,OK,QlikView 1-1,text,true,11283,1,1,750
1410169715430,1,Remove CHNAMESTEMP variables,200,OK,QlikView 1-1,text,true,0,1,1,0
1410169709032,6400,Inventory Momentum #41,,"Number of samples in transaction : 6, number of failing samples : 1",QlikView 1-1,,false,22568,1,1,2726
1410169747785,0,BeanShell Sampler UniformTimer,200,OK,QlikView 1-1,text,true,0,1,1,0
1410169715436,32349,"Timer Delay - UniformTimer [30000,5000] #42",200,"Number of samples in transaction : 1, number of failing samples : 0",QlikView 1-1,,true,0,1,1,0
1410169747800,4012,Clear all Request,200,OK,QlikView 1-1,text,false,11282,1,1,1920
1410169751996,1884,Poll,200,OK,QlikView 1-1,text,true,11283,1,1,486
1410169753905,1,Remove CHNAMESTEMP variables,200,OK,QlikView 1-1,text,true,0,1,1,0
1410169747799,6111,Clear All #43,,"Number of samples in transaction : 6, number of failing samples : 1",QlikView 1-1,,false,22565,1,1,2406
1410169787153,0,BeanShell Sampler UniformTimer,200,OK,QlikView 1-1,text,true,0,1,1,0
1410169753914,33238,"Timer Delay - UniformTimer [30000,5000] #44",200,"Number of samples in transaction : 1, number of failing samples : 0",QlikView 1-1,,true,0,1,1,0
1410169787175,4694,Change sheet Request,200,OK,QlikView 1-1,text,false,11282,1,1,1804
1410169792053,2515,Poll,200,OK,QlikView 1-1,text,true,11280,1,1,539
1410169794581,1,Remove CHNAMESTEMP variables,200,OK,QlikView 1-1,text,true,0,1,1,0
1410169787167,7417,Inventory Map #45,,"Number of samples in transaction : 6, number of failing samples : 1",QlikView 1-1,,false,22562,1,1,2343
1410169829275,1,BeanShell Sampler UniformTimer,200,OK,QlikView 1-1,text,true,0,1,1,0
1410169794588,34686,"Timer Delay - UniformTimer [30000,5000] #46",200,"Number of samples in transaction : 1, number of failing samples : 0",QlikView 1-1,,true,0,1,1,0
thanks,
Rajesh Vaswani