Unlock a world of possibilities! Login now and discover the exclusive benefits awaiting you.
- Qlik Community
- :
- Forums
- :
- Groups
- :
- Industry and Topics
- :
- Scalability
- :
- Re: Qlik Sense Scalability Tools
- Subscribe to RSS Feed
- Mark Topic as New
- Mark Topic as Read
- Float this Topic for Current User
- Bookmark
- Subscribe
- Mute
- Printer Friendly Page
- Feature this Topic
- Mark as New
- Bookmark
- Subscribe
- Mute
- Subscribe to RSS Feed
- Permalink
- Report Inappropriate Content
Qlik Sense Scalability Tools
This package (referred to as Qlik Sense Scalability Tools) contains a complete set of tools for easy creation, execution and analysis of load/performance tests.
This tool is now deprecated and will not receive any further updates, please use the Qlik Sense Enterprise Scalability Tools instead.
Supported versions of Qlik Sense: all 2020, all 2021, 2022-aug
Included parts are:
- Standalone application for creating and executing a simulation script
- Documentation on how to use the package
- Regression analyzer
- Benchmarking package
- App evaluator package
QlikView and Qlik Sense documents to help analyze result and log files (previously included in this package) can be found here :https://community.qlik.com/docs/DOC-15451
Troubleshooting
For help to troubleshoot connection problems, please review Appendix A of the documentation or Connection Troubleshooting Tips
Change log
v5.17.0
- Add support for Qlik Sense May 2022 release
- Add support for Qlik Sense Aug 2022 release
v5.16.0
- Add support for Qlik Sense Feb 2022 release
v5.15.0
- Add support for Qlik Sense Nov 2021 release
v5.14.0
- Add support for Qlik Sense Aug 2021 release
(See Readme.txt for changes in earlier versions of the tool.)
Your use of Qlik Sense Scalability Tool will be subject to the same license agreement between you and Qlik for your Qlik Sense License. Qlik does not provide maintenance and support services for the Qlik Sense Scalability Tool, however please check QlikCommunity for additional information on use of these products.
- Tags:
- Group_Documents
- load testing
- load_testing
- performance
- performance_&_scalability
- performance_testing
- scalability
- Mark as New
- Bookmark
- Subscribe
- Mute
- Subscribe to RSS Feed
- Permalink
- Report Inappropriate Content
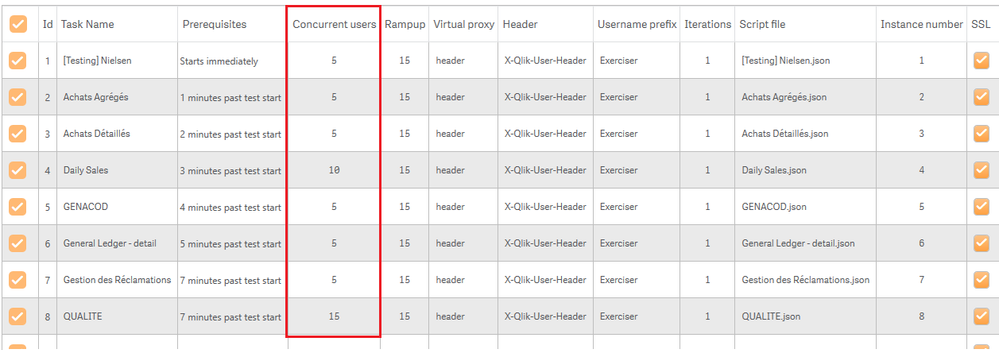
This is my test scheduler : I set 5 to 25 concurrent users on 11 different application.
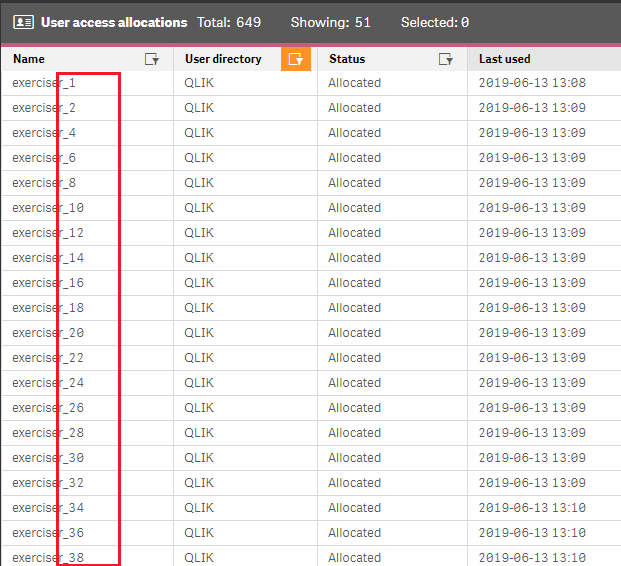
The User access allocations look wierd. As you can see : Exerciser_2/4/6 ... but I Don't have 3/5/7 ...
Due to a bug ? Or my settings ?
- Mark as New
- Bookmark
- Subscribe
- Mute
- Subscribe to RSS Feed
- Permalink
- Report Inappropriate Content
What are your user creation settings inside the scripts?
- Mark as New
- Bookmark
- Subscribe
- Mute
- Subscribe to RSS Feed
- Permalink
- Report Inappropriate Content
Like this :
- Mark as New
- Bookmark
- Subscribe
- Mute
- Subscribe to RSS Feed
- Permalink
- Report Inappropriate Content
That's strange. Does it happen only when you execute through the test scheduler or also if executing a single script with the executor?
Maybe something is causing every other user to not be able to access the system. Are there any errors in the result/log files?
- Mark as New
- Bookmark
- Subscribe
- Mute
- Subscribe to RSS Feed
- Permalink
- Report Inappropriate Content
I use ScenarioWorker before and the number was ok : Exerciser 1,2, 3 ...
(latest test with this mode in october and february)
I choose to work in ChangeSheetWorker since May and I notice the new way to numbered.
- Mark as New
- Bookmark
- Subscribe
- Mute
- Subscribe to RSS Feed
- Permalink
- Report Inappropriate Content
There might be something strange going on with the SheetChangerWorker. We usually use it to preload an app by going through its sheets with only 1 user, but it is also possible to run it with more users. We'll have to look into this as a potential bug!
- Mark as New
- Bookmark
- Subscribe
- Mute
- Subscribe to RSS Feed
- Permalink
- Report Inappropriate Content
Hi again! I can confirm that this is a bug in the SheetChangerWorker. I looked into some of our logs and we see the same thing internally. It should still produce the correct number of users, but the numbering is wrong. If there is any other issue please let me know.
Thank you for bringing this issue to our attention!
- Mark as New
- Bookmark
- Subscribe
- Mute
- Subscribe to RSS Feed
- Permalink
- Report Inappropriate Content
Hi,
Thanks for your answer. As I said, this tools is very usefull 🙂
Glad to help you.
- Mark as New
- Bookmark
- Subscribe
- Mute
- Subscribe to RSS Feed
- Permalink
- Report Inappropriate Content
Hello everyone!
How to correctly measure the performance load on the server with 1000 simultaneous user sessions?
- Mark as New
- Bookmark
- Subscribe
- Mute
- Subscribe to RSS Feed
- Permalink
- Report Inappropriate Content
Depends on how you define "performance load"...
I tend to view performance testing as a two-phase activity:
- Establish load on the system. This can be done in different ways - which one is best depends on what you want to achieve:
- using real users, i.e. running the tests on production (or QA/test/staging) systems
- using a tool like the Scalability tools
- using a tool like Butler Cache Warmer (disclaimer: I wrote most of that tool) to ensure certain apps are always loaded, with one or more user accounts used to load the apps
- Monitor the load on the Sense server(s). This can also be done in different ways - once again pick the one relevant for what you want to achieve.
- Use Windows Resource Monitor or similar to monitor Windows level metrics in real time (and in retrospect, if you log the metrics to disk)
- Use the Qlik Sense Operations Monitor to analyse in retrospect what happened in the Sense environment during the load test done in step 1.
- Use a tool like Butler SOS (disclaimer again - I wrote most of that tool..) It will give you very close to real-time insight into what happens in your Sense servers, combining metrics from both Sense and Windows realms.
Butler SOS is also a very useful tool for everyday operational monitoring of Sense servers.
Basically, it makes sure YOU are the first to be alerted when something breaks. Which is much better than your end users telling you something is broken...
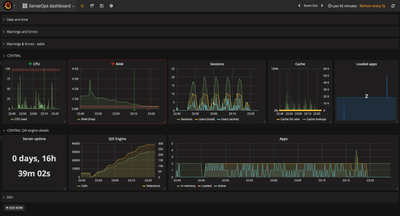
Sample screen shot showing CPU load, RAM usage, # sessions etc for a server. Metrics collected using Butler SOS and charted using Grafana.
And just to be clear: There for sure are other ways - and other tools - that can be used. The above works well for me though.
- Tags:
- devops
- monitoring


