Unlock a world of possibilities! Login now and discover the exclusive benefits awaiting you.
- Qlik Community
- :
- Forums
- :
- Analytics
- :
- App Development
- :
- Re: A Lot of AGGR Functions in a Quartile Chart
- Subscribe to RSS Feed
- Mark Topic as New
- Mark Topic as Read
- Float this Topic for Current User
- Bookmark
- Subscribe
- Mute
- Printer Friendly Page
- Mark as New
- Bookmark
- Subscribe
- Mute
- Subscribe to RSS Feed
- Permalink
- Report Inappropriate Content
A Lot of AGGR Functions in a Quartile Chart
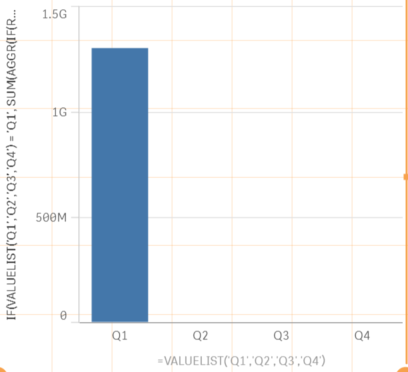
I have this quartile chart, but only the first one shows up. I've tested this method with other functions, but I think the expression is too long or holding too much data.
Here's my dimension:
![]()
Here's my expression (without Q3 and Q4 filled in):
![]()
Can anyone help see a problem or suggest ways I can get this to work?
- Mark as New
- Bookmark
- Subscribe
- Mute
- Subscribe to RSS Feed
- Permalink
- Report Inappropriate Content
It some kind of grain mismatch issue which is basically addressed by NODISTINCT. To read about grain mismatch look at HIC's blog here: Pitfalls of the Aggr function
- Mark as New
- Bookmark
- Subscribe
- Mute
- Subscribe to RSS Feed
- Permalink
- Report Inappropriate Content
- Mark as New
- Bookmark
- Subscribe
- Mute
- Subscribe to RSS Feed
- Permalink
- Report Inappropriate Content
To clarify what my expression is trying to do: find the SUM of Loan_Amounts for Account Executives who are in the Upper 25%, 25-50%, 50-75%, and lower 25% (quartiles which has nothing to do with date).
In example I gave above, the only difference is the orientation of the >. The example was really finding the upper 25% of Account Executives and the lower 75%.
I will post the full expression and what the chart looks like shortly.
- Mark as New
- Bookmark
- Subscribe
- Mute
- Subscribe to RSS Feed
- Permalink
- Report Inappropriate Content
Do you really need the aggr() in the advanced search (which is already grouping by [Account Executive]?
SUM({<[Account Executive]={"=RANK( SUM(Loan_Amount) ,4)>COUNT(TOTAL DISTINCT [Account Executive])*.75"}>} Loan_Amount))
should probably work as well
- Mark as New
- Bookmark
- Subscribe
- Mute
- Subscribe to RSS Feed
- Permalink
- Report Inappropriate Content
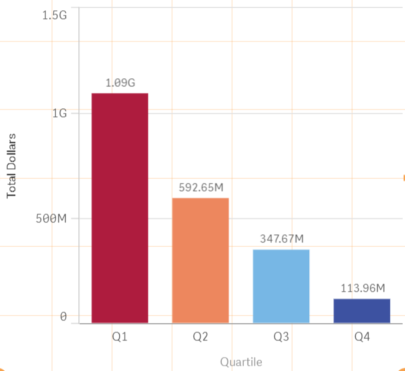
Here it is in all it's glory! The chart shows the SUM of Loan_Amounts for Account Executives who are ranked in the Upper 25% of all Account Executives, Upper Middle 25-50%, Lower Middle 50-75%, and Lower 25%.
The massive expression is as follows:
IF(VALUELIST('Q1','Q2','Q3','Q4') = 'Q1',SUM({<[Account Executive]={"=RANK(SUM(Loan_Amount),4)<$(vQ1)"}>} Loan_Amount),
IF(VALUELIST('Q1','Q2','Q3','Q4') = 'Q2',SUM({<[Account Executive]={"=RANK(SUM(Loan_Amount),4)<$(vQ2) AND RANK(SUM(Loan_Amount),4)>=$(vQ1)"}>} Loan_Amount),
IF(VALUELIST('Q1','Q2','Q3','Q4') = 'Q3', SUM({<[Account Executive]={"=RANK(SUM(Loan_Amount),4)<$(vQ3) AND RANK(SUM(Loan_Amount),4)>=$(vQ2)"}>} Loan_Amount),
IF(VALUELIST('Q1','Q2','Q3','Q4') = 'Q4',SUM({<[Account Executive]={"=RANK(SUM(Loan_Amount),4)>=$(vQ3)"}>} Loan_Amount)))))
The variables in this equation were used to keep the length of the expression manageable and I use them elsewhere in the App. They are taking the count of distinct Account Executives and dividing by 2 and 4 to get vQ2 and vQ1, and multiplying by .75 to get vQ3.
- Mark as New
- Bookmark
- Subscribe
- Mute
- Subscribe to RSS Feed
- Permalink
- Report Inappropriate Content
Yeah that actually works, too. I don't understand how this works behind the scenes, but it is giving me the correct data.
I do, however, rely on AGGR in other areas of my app which were also not working due to the issue that stalwar1 identified in which case I will have to do more testing of your proposed solution to see if they work in those cases as well.
Thanks!
- Mark as New
- Bookmark
- Subscribe
- Mute
- Subscribe to RSS Feed
- Permalink
- Report Inappropriate Content
Hi everybody,
sorry I'm terribly late to the party, but allow me nevertheless explain some of the concepts mentioned here and perhaps offer a more elegant alternative:
1. AGGR and ValueList - so, the issue is not quite a "grain mismatch", as Sunny suggested, but rather related to the definition of a DISTINCT vs. NODISTINCT AGGR(). The DISTINCT AGGR, by definition, returns a single value for each distinct combination of the dimensions. This chart, because of the ValueList, technically requires multiple values - one for Q1, one for Q2, one for Q3 and one for Q4. The conditional logic that renders only one AGGR for each single value, is being essentially ignored - the AGGR still returns a single value, hence the initial problem of only having one bar. And, since AGGR() dimensions can only include fields (not functions), adding the VALUELIST is not an option. The solution can be achieved with NODISTINCT, however it's not always the correct calculation (depending on the expression).
2. The working solution can be, indeed, achieved without the use of AGGR(), as Stephan had suggested - because using Advanced Search in Set Analysis contains an implied AGGR() on the filtered Dimension (Account Executive in this case).
3. On the other hand, AGGR() could be used here in a lot more elegant way - replacing the ValueList and the 4 nested IF() functions in the Expression. The Calculated Dimension with the AGGR() function can calculate the Quartile per Account Executive, and the expression can be a simple sum(Amount). I'll try to formulate it here, without guaranteeing a 100% accurate syntax:
Calculated Dimension for Quartile:
= AGGR(
'Q' & ceil(RANK(SUM(Loan_Amount),4)/COUNT(DISTINCT TOTAL [Account Executive]) * 4)
, [Account Executive])
expression for Loan Amount:
SUM(Loan_Amount)
If you are interested in learning more about advanced uses of AGGR() and Set Analysis, please consider attending one of the upcoming sessions of the Masters Summit for Qlik - coming soon to Austin, TX and to Johannesburg, South Africa. You can also learn these and many other Qlik techniques from my recently published book QlikView Your Business.
cheers,
Oleg Troyansky
- Mark as New
- Bookmark
- Subscribe
- Mute
- Subscribe to RSS Feed
- Permalink
- Report Inappropriate Content
Well this is a lot smarter than what I was doing.
Thanks!
- Mark as New
- Bookmark
- Subscribe
- Mute
- Subscribe to RSS Feed
- Permalink
- Report Inappropriate Content
I'm going to write a blog post, describing a similar issue and the possible solutions
- Mark as New
- Bookmark
- Subscribe
- Mute
- Subscribe to RSS Feed
- Permalink
- Report Inappropriate Content
Cool, let me know if you'd like any additional input.