Unlock a world of possibilities! Login now and discover the exclusive benefits awaiting you.
- Qlik Community
- :
- Forums
- :
- Analytics
- :
- App Development
- :
- A Lot of AGGR Functions in a Quartile Chart
- Subscribe to RSS Feed
- Mark Topic as New
- Mark Topic as Read
- Float this Topic for Current User
- Bookmark
- Subscribe
- Mute
- Printer Friendly Page
- Mark as New
- Bookmark
- Subscribe
- Mute
- Subscribe to RSS Feed
- Permalink
- Report Inappropriate Content
A Lot of AGGR Functions in a Quartile Chart
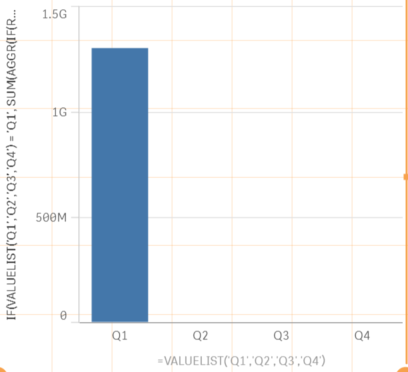
I have this quartile chart, but only the first one shows up. I've tested this method with other functions, but I think the expression is too long or holding too much data.
Here's my dimension:
![]()
Here's my expression (without Q3 and Q4 filled in):
![]()
Can anyone help see a problem or suggest ways I can get this to work?
- « Previous Replies
- Next Replies »
- Mark as New
- Bookmark
- Subscribe
- Mute
- Subscribe to RSS Feed
- Permalink
- Report Inappropriate Content
Hi everyone!
For anyone who is still confused by this issue, I published a blog article on my web site:
Q-Tip # 14 – AGGR() and Synthetic Dimensions | Natural Synergies
Enjoy!
Oleg Troyansky
Upgrade your Qlik skills at the Masters Summit for Qlik - coming soon to Austin, TX and Johannesburg, South Africa!
- Mark as New
- Bookmark
- Subscribe
- Mute
- Subscribe to RSS Feed
- Permalink
- Report Inappropriate Content
By the way, I just spent hours resolving an error with this equation. That is, the AGGR around the RANK equation will not work properly if you have any null values in the AGGR field (Account Executive).
Therefore, I had to add some set analysis and change the RANK mode (in case of ties) to make it perfect.
= AGGR({<[Account Executive]=P()>} 'Q' & CEIL(RANK(SUM(Loan_Amount),2)/COUNT(DISTINCT TOTAL [Account Executive]) * 4), [Account Executive])
Thanks!
- Mark as New
- Bookmark
- Subscribe
- Mute
- Subscribe to RSS Feed
- Permalink
- Report Inappropriate Content
Hi Tim!
this is a nice finding, about the NULL values, I wasn't aware of it. For the RANK mode, don't you want to use mode 4 - number any equal values sequentially?
thanks for adding your input!
Oleg Troyansky
- Mark as New
- Bookmark
- Subscribe
- Mute
- Subscribe to RSS Feed
- Permalink
- Report Inappropriate Content
The problem with the sequential numbers is that ties could be split between two quartiles. Using mode 2 takes the average rank of all those that tied and forces all ties to at least be in the same quartile, though it can make for some funky looking charts when there are ties with small groups with populations like 5 or 11.
Here's the information about the Rank function: https://help.qlik.com/en-US/sense/1.1/Subsystems/Hub/Content/ChartFunctions/RankingFunctions/rank.ht...
- Mark as New
- Bookmark
- Subscribe
- Mute
- Subscribe to RSS Feed
- Permalink
- Report Inappropriate Content
Yes, exactly! Depending on your analytical needs, you may want to keep all the ties together or prefer to keep identical number of entries in all buckets. For bucket analysis, the need to keep identically sized buckets prevails, despite the ties.
- « Previous Replies
- Next Replies »