Unlock a world of possibilities! Login now and discover the exclusive benefits awaiting you.
- Qlik Community
- :
- Forums
- :
- Analytics
- :
- App Development
- :
- Adding custom column to pivot table
- Subscribe to RSS Feed
- Mark Topic as New
- Mark Topic as Read
- Float this Topic for Current User
- Bookmark
- Subscribe
- Mute
- Printer Friendly Page
- Mark as New
- Bookmark
- Subscribe
- Mute
- Subscribe to RSS Feed
- Permalink
- Report Inappropriate Content
Adding custom column to pivot table
Hi everyone.
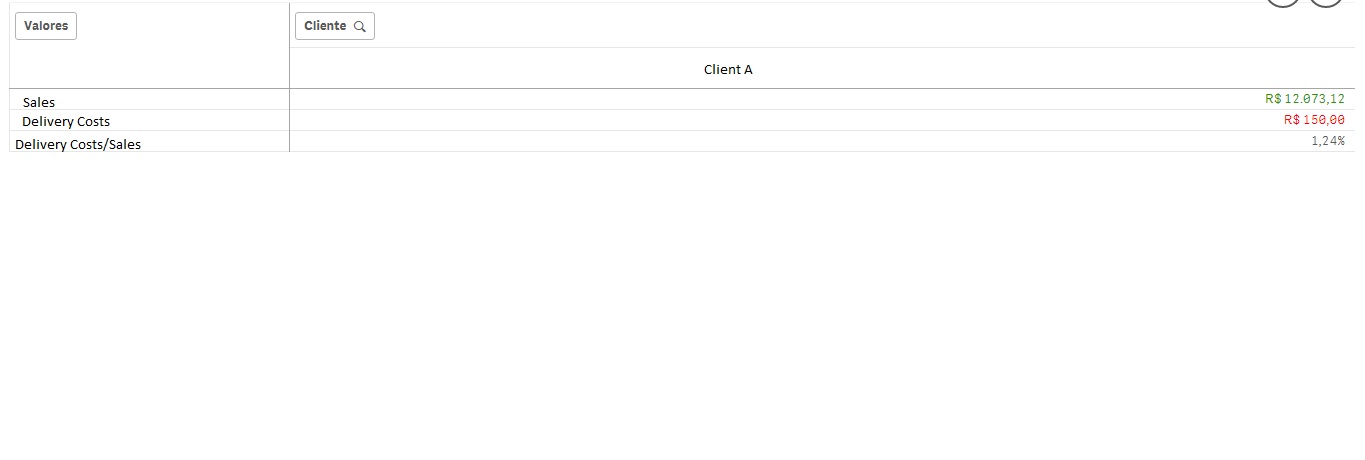
I would like to convert the Delivery Costs/Sales row into a new column in the pivot table below so the percentage value is displayed right next to the delivery costs value. It could be even in the same cell as the delivery costs value. For instance, it would show R$ 150,00 (1,24%).
The Sales and DeliveryCosts come from different tables and both are associated to another table through ClientID.
It seems both options are easily doable, but I am unable to solve it. I wouldappreaciate any help!
- Mark as New
- Bookmark
- Subscribe
- Mute
- Subscribe to RSS Feed
- Permalink
- Report Inappropriate Content
Hi Renan,
It seems that you swap the Clients/Valores will do the work.
G.
- Mark as New
- Bookmark
- Subscribe
- Mute
- Subscribe to RSS Feed
- Permalink
- Report Inappropriate Content
Drag and drop of columns, it'll make values as Individual columns.
You can use Crosstable load in script.
Or
Declare field with this value as Individual one, use that in Pivot table.
- Mark as New
- Bookmark
- Subscribe
- Mute
- Subscribe to RSS Feed
- Permalink
- Report Inappropriate Content
Hey Gabor,
That sets all my current rows as columns, in a way that all my values are side to side to each other, but I want only the Delivery Costs/Sales as a column.
- Mark as New
- Bookmark
- Subscribe
- Mute
- Subscribe to RSS Feed
- Permalink
- Report Inappropriate Content
Hey Bala,
I have tried all possible drag and drop combinations without success so far.
The Delivery Costs/Sales value was created through a chart function.
I'm not sure how to implement the second option you suggested. Ideally, I would make this calculation in my excel files and just choose to show them in my pivot table as a new column. But the two values needed for the calculation come from different workbooks. I thought it would be easier to do it on Qlik Sense, but my knowledge is limited.
- Mark as New
- Bookmark
- Subscribe
- Mute
- Subscribe to RSS Feed
- Permalink
- Report Inappropriate Content
I found a thread in which someone has the same issue. Perhaps they explained better what we want.
Re: Pivot Table Column