Unlock a world of possibilities! Login now and discover the exclusive benefits awaiting you.
- Qlik Community
- :
- Forums
- :
- Analytics
- :
- App Development
- :
- Aggr on a graph - incorrect values
- Subscribe to RSS Feed
- Mark Topic as New
- Mark Topic as Read
- Float this Topic for Current User
- Bookmark
- Subscribe
- Mute
- Printer Friendly Page
- Mark as New
- Bookmark
- Subscribe
- Mute
- Subscribe to RSS Feed
- Permalink
- Report Inappropriate Content
Aggr on a graph - incorrect values
Hello everyone,
I have a KPI that shows average travel days (Días promedio de viaje).

Its formula is

When I take the same expression and remove the date filters to use it in a chart by month year the values are not the same as the ones showed on the KPI (as I expected)
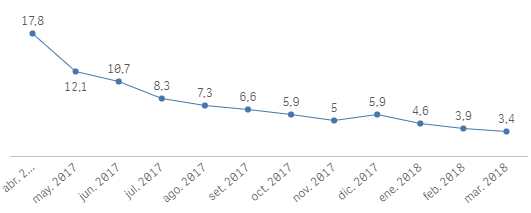
The weird thing is when I filter a month the graph shows the same nuber as the KPI. It suggests me an issue with the Key and the dates but I am not finding what exactly can be the problem.

Any help on this would be very appreciated.
Thanks,
Josefina
Accepted Solutions
- Mark as New
- Bookmark
- Subscribe
- Mute
- Subscribe to RSS Feed
- Permalink
- Report Inappropriate Content
Right, can you add that to the Aggr() function also?
Avg({<....>}Aggr( ....., movil, [Mes Ano]))
- Mark as New
- Bookmark
- Subscribe
- Mute
- Subscribe to RSS Feed
- Permalink
- Report Inappropriate Content
May be you need to add Mes Ano as one of the dimension to your aggr function....
- Mark as New
- Bookmark
- Subscribe
- Mute
- Subscribe to RSS Feed
- Permalink
- Report Inappropriate Content
Hi Sunny, thanks for your answer.
The dimension on the graph is mes año
- Mark as New
- Bookmark
- Subscribe
- Mute
- Subscribe to RSS Feed
- Permalink
- Report Inappropriate Content
Right, can you add that to the Aggr() function also?
Avg({<....>}Aggr( ....., movil, [Mes Ano]))
- Mark as New
- Bookmark
- Subscribe
- Mute
- Subscribe to RSS Feed
- Permalink
- Report Inappropriate Content
It worked! Thank you so much!