Unlock a world of possibilities! Login now and discover the exclusive benefits awaiting you.
- Qlik Community
- :
- Forums
- :
- Analytics
- :
- App Development
- :
- Re: Averaging over non-exising entries in table
Options
- Subscribe to RSS Feed
- Mark Topic as New
- Mark Topic as Read
- Float this Topic for Current User
- Bookmark
- Subscribe
- Mute
- Printer Friendly Page
Turn on suggestions
Auto-suggest helps you quickly narrow down your search results by suggesting possible matches as you type.
Showing results for
Contributor
2018-02-01
07:38 AM
- Mark as New
- Bookmark
- Subscribe
- Mute
- Subscribe to RSS Feed
- Permalink
- Report Inappropriate Content
Averaging over non-exising entries in table
I have a seemingly simple issue, but despite trying a lot, I have not found a solution to that.
Here's the stripped down question:
Assume, that I am producing Cars with serial numbers. They are listed in a table "Cars", and have (amongst other data) the Fields Serial and FabricationDate.
Cars:
LOAD * INLINE [
Serial, FabricationDate
1, 01.01.2018 2, 01.01.2018
3, 02.01.2018
4, 02.01.2018
5, 02.01.2018
6, 03.01.2018
7, 03.01.2018
];
For each of my Cars, I have different Parts used during production; not every car gets all PartsUsed, so I have a table, connecting the Serial with the Material (Foo, Bar, or Toast) and the Cost of this Part (in the example, each Material has a fixed price, but in reality, it is flexible, as it may contain actual assembly time)
In that table, only actually used parts are listed; If I don't use "Bar" for Serial 1, there is no row containing Serial=1 and Material = "Bar"
PartsUsed:
LOAD * INLINE [
Serial, Material, Cost
1, Foo, 10
1, Toast, 30
2, Bar, 20
2, Toast, 30
3, Bar, 20
3, Toast, 30
4, Foo, 10
4, Bar, 20
4, Toast, 30
5, Foo, 10
5, Bar, 20
5, Toast, 30
6, Foo, 10
6, Bar, 20
6, Toast, 30
7, Foo, 10
7, Bar, 20
7, Toast, 30
];
So now I want to see the average cost per day, and I make a table containing
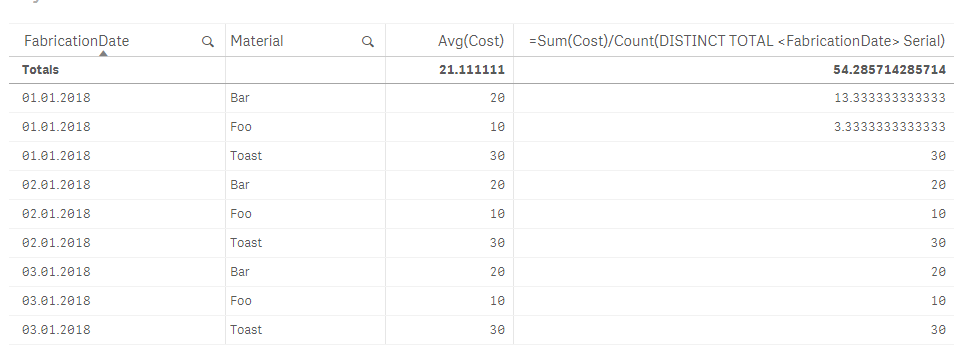
Dimension1: FabricationDate, Dimension2: Material, Measure: Avg(Cost)
So, Qlik does the average over the existing materials per Serial, but does not consider Materials not used for that Serial.
(For Day 01.01.2018, I would like to have something like 3.33 (=10/3) for Foo, 13.333 (=(20+20)/3)for Bar, and 30 (3*30/3) for Toast, but the result looks like this: )
| FabricationDate | Material | avg(Cost) |
|---|---|---|
| 01.01.2018 | Toast | 30 |
| 01.01.2018 | Bar | 20 |
| 01.01.2018 | Foo | 10 |
| 02.01.2018 | Toast | 30 |
| 02.01.2018 | Bar | 20 |
| 02.01.2018 | Foo | 10 |
| 03.01.2018 | Toast | 30 |
| 03.01.2018 | Bar | 20 |
| 03.01.2018 | Foo | 10 |
I've fiddled around with doing the average on my own, or using AGGR, but I have not found a solution.
Maybe someone can help me out? Should be a common issue, I would guess, and I am just blindfolded...
(Do I need to artificially create all Materials for each Serial? How would I do that, if the Materials list may be expanding over time?)
Thank you very much in advance!
467 Views
1 Solution
Accepted Solutions
MVP
2018-02-01
01:26 PM
- Mark as New
- Bookmark
- Subscribe
- Mute
- Subscribe to RSS Feed
- Permalink
- Report Inappropriate Content
May be try this
=Sum(Cost)/Count(DISTINCT TOTAL <FabricationDate> Serial)
I am assuming that Serial number 3 has a fabrication date of 01.01.2018
406 Views
2 Replies
MVP
2018-02-01
01:26 PM
- Mark as New
- Bookmark
- Subscribe
- Mute
- Subscribe to RSS Feed
- Permalink
- Report Inappropriate Content
May be try this
=Sum(Cost)/Count(DISTINCT TOTAL <FabricationDate> Serial)
I am assuming that Serial number 3 has a fabrication date of 01.01.2018
407 Views
Contributor
2018-02-02
08:27 AM
Author
- Mark as New
- Bookmark
- Subscribe
- Mute
- Subscribe to RSS Feed
- Permalink
- Report Inappropriate Content
Hi Sunny,
thanks a lot for your help, that was the solution!
Kind regards
406 Views
Community Browser