Unlock a world of possibilities! Login now and discover the exclusive benefits awaiting you.
- Qlik Community
- :
- Forums
- :
- Analytics
- :
- App Development
- :
- Re: Calculate current/ongoing projects per month
- Subscribe to RSS Feed
- Mark Topic as New
- Mark Topic as Read
- Float this Topic for Current User
- Bookmark
- Subscribe
- Mute
- Printer Friendly Page
- Mark as New
- Bookmark
- Subscribe
- Mute
- Subscribe to RSS Feed
- Permalink
- Report Inappropriate Content
Calculate current/ongoing projects per month
I have a list of different projects with their planned start/ finish date and actual start/finish data.

Now, I want to show a KPI that displays count of projects ongoing or newly started in a particular month. For example, I build a KPI with title as current month( based on Actual Start/ Finish date) where project name jkl should be counted in the month of March(when project has its actual start date) as well as April( where the project is ongoing). So if a project has a start date of February and end date of April, the project should be counted in each and every month between start and end date. I tried using master calendar measure but it doesn't have the option of showing ongoing months.
Can any one help what is the best way to show such KPI in dash board ?
- Tags:
- kpi
- Mark as New
- Bookmark
- Subscribe
- Mute
- Subscribe to RSS Feed
- Permalink
- Report Inappropriate Content
You can build an Interval Match table that enables you to do this.
I created an inline table of your data and a sample IntervalMatch table. I hard-coded everything, but for a permanent solution, you'd want to calculate the YearMonth fields and create the IntervalMatch table using logic similar to creating a MasterCalendar Table.
The Interval Match does a nice job of linking each project to each month that it occurs in. By removing the "day" part of the date and using just Year and Month, it enables you to ignore when in the month and just that it was in the month.
See the attached Sample.qvf file.
You will need to be careful in how you use the Interval Match data and clean-up should be done to remove the synthetic key, but this should point you in the right direction. There may be other options, but this has worked for me in the past.
Greg
- Mark as New
- Bookmark
- Subscribe
- Mute
- Subscribe to RSS Feed
- Permalink
- Report Inappropriate Content
Thanks for your prompt response. But the qvf you provided, I cannot open it on Qlik Sense server. Also I don't have admin permissions to open any external file with the help of QMC. Can you just post screenshots of the content present in qvf file over here?
- Mark as New
- Bookmark
- Subscribe
- Mute
- Subscribe to RSS Feed
- Permalink
- Report Inappropriate Content
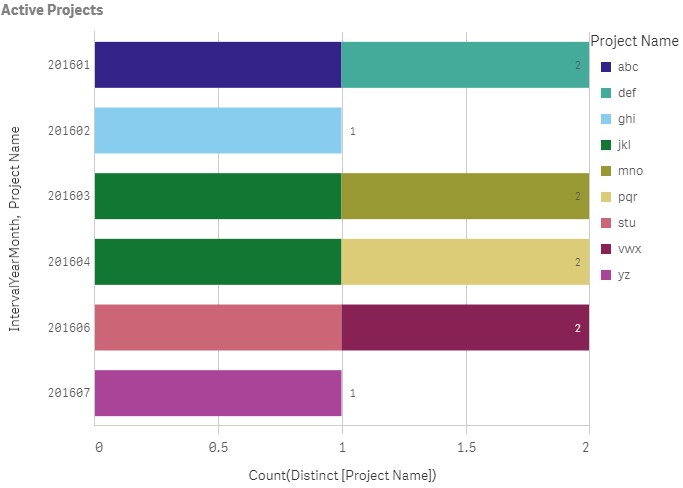
Here's my load script and I'll attach a few pictures of a table and stacked bar visualization.
ProjectDates:
LOAD * Inline [
Project Name,Actual Start,Actual Finish,ActualStartYearMonth,ActualFinishYearMonth
abc,01/05/2016,01/30/2016,201601,201601
def,01/01/2016,01/06/2016,201601,201601
ghi,02/02/2016,02/25/2016,201602,201602
jkl,03/28/2016,04/10/2016,201603,201604
mno,03/12/2016,03/20/2016,201603,201603
pqr,04/02/2016,04/10/2016,201604,201604
stu,06/29/2016,06/30/2016,201606,201606
vwx,06/28/2016,06/28/2016,201606,201606
yz,07/10/2016,07/12/2016,201607,201607
];
IntervalData:
LOAD * Inline [
IntervalYear,IntervalMonth,IntervalYearMonth
2016,1,201601
2016,2,201602
2016,3,201603
2016,4,201604
2016,5,201605
2016,6,201606
2016,7,201607
2016,8,201608
2016,9,201609
2016,10,201610
2016,11,201611
2016,12,201612
];
Inner Join IntervalMatch ( IntervalYearMonth )
LOAD ActualStartYearMonth, ActualFinishYearMonth
Resident ProjectDates;