Unlock a world of possibilities! Login now and discover the exclusive benefits awaiting you.
- Qlik Community
- :
- Forums
- :
- Analytics
- :
- App Development
- :
- Re: Calculating average sales
- Subscribe to RSS Feed
- Mark Topic as New
- Mark Topic as Read
- Float this Topic for Current User
- Bookmark
- Subscribe
- Mute
- Printer Friendly Page
- Mark as New
- Bookmark
- Subscribe
- Mute
- Subscribe to RSS Feed
- Permalink
- Report Inappropriate Content
Calculating average sales
Hello, I have a quite basic question. Imagine a sales table where for each product the sales amount is recorded monthly, something like this:
ProductName SalesDate SalesAmount
------------- -------------- -----------
A 01/11/2014 10
A 01/03/2015 30
B 01/04/2015 10
A 01/05/2015 10
A 01/07/2015 30
A 01/11/2015 10
A 01/02/2016 20
B 01/02/2016 40
A 01/03/2016 10
For each product, I have also the date where sales has started:
ProductName StartSalesDate
------------ ----------------
A 01/11/2014
B 01/03/2015
I would like to get a summary with a monthly average over a period, but taking into consideration StartSalesDate. For example, if 01/03/2016 is the max date limit, with no period selected (all-time sales) I would have
ProductName Total Sales AverageMonthlySales
------------ -------------- ------------------
A 120 7,05 (i.e. 120/17)
B 50 4,61 (i.e. 50/12)
but selecting 2015 as period, I should obtain:
ProductName Total Sales AverageMonthlySales
------------ -------------- ------------------
A 80 6,66 (i.e. 80/12)
B 10 1,00 (i.e. 10/10)
and selecting 2016
ProductName Total Sales AverageMonthlySales
------------ -------------- ------------------
A 30 10 (i.e. 30/3)
B 40 13,3 (i.e. 40/3)
What would be a correct approach to do this in your experience?
Many thanks,
Franco
- Mark as New
- Bookmark
- Subscribe
- Mute
- Subscribe to RSS Feed
- Permalink
- Report Inappropriate Content
Try this expression:
=Sum(SalesAmount)
/
(((Year(Max(SalesDate)) * 12) + Month(RangeMin(Max({1}SalesDate), YearEnd(Max(SalesDate))))) + 1 -
If(Year > Year(StartSalesDate),
(((Year(YearStart(Min(SalesDate)))*12)+Month(YearStart(Min(SalesDate))))),
(((Year(StartSalesDate)*12)+Month(StartSalesDate)))))
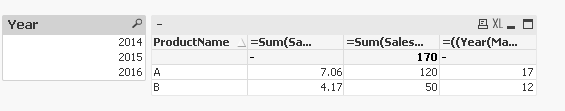
When nothing is selected:
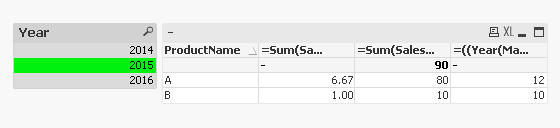
When 2015 is selected
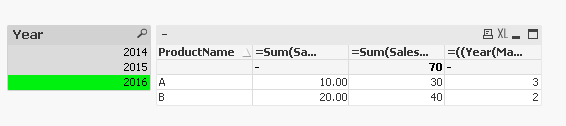
When 2016 is selected:
I think two places it doesn't match is when nothing is selected you have 50/12 as 4.61, where as I think it should be 4.16667 (or 4.17)
and second place is when 2016 is selected B's max date seems to be 01/02/2016, so it should be 2 months, not 3, right?
Attaching the application for you to play around with.
Best,
Sunny
- Mark as New
- Bookmark
- Subscribe
- Mute
- Subscribe to RSS Feed
- Permalink
- Report Inappropriate Content
Attached a different solution.
I assumed that you want to count the months up to today's months for 2016 or if nothing is selected.
(Currently you are only counting months up to the max month in your sales fact table, but you don't have records for all months).
You can adjust this by changing the vEndDate variable in the script.
I've also added a kind of master calendar which makes it easier to get the min and max month numbers per selection and also allows to draw your data on a time base without missing months.
- Mark as New
- Bookmark
- Subscribe
- Mute
- Subscribe to RSS Feed
- Permalink
- Report Inappropriate Content
Did not realize this was Qlik Sense
Attaching a QlikSense sample application as well 
- Mark as New
- Bookmark
- Subscribe
- Mute
- Subscribe to RSS Feed
- Permalink
- Report Inappropriate Content
Thank you Swuehl and Sunny T, both your solutions works perfectly, I was fighting with an expression similar to the Sunny T one, when I realized in fact that i was missing a "total", and that for this reason the result was dependent from the selection. Thank you again for your answers, I've learnt a lot from both!