Unlock a world of possibilities! Login now and discover the exclusive benefits awaiting you.
- Qlik Community
- :
- Forums
- :
- Analytics
- :
- App Development
- :
- Changing color gradient of scatter plot using Colo...
- Subscribe to RSS Feed
- Mark Topic as New
- Mark Topic as Read
- Float this Topic for Current User
- Bookmark
- Subscribe
- Mute
- Printer Friendly Page
- Mark as New
- Bookmark
- Subscribe
- Mute
- Subscribe to RSS Feed
- Permalink
- Report Inappropriate Content
Changing color gradient of scatter plot using ColorMix1
Hi,
I'm trying to get a different color gradient on my scatter plot using the custom color expression.
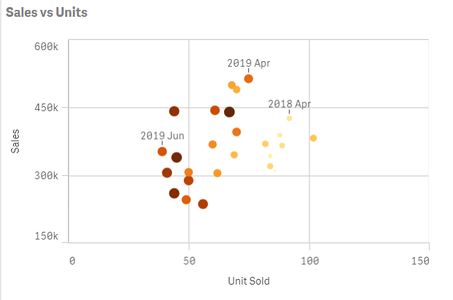
Am trying to achieve the same effect as the attached picture but with a green gradient instead of the default orange to dark red. I basically want the newest data points to be darker in color and the oldest to be lighter in color.
I've tried to use the following code but it doesnt work. [Month_out] is the dimension in this case, and so is the measure.
Colormix1( (([Month_out]-$(=min([Month_out]))),[Month_out])/(($(=max([Month_out]))-$(=min([Month_out]))),[Month_out]),Green(),Lightgreen())
Wondering what I'm doing wrong , as the plot just turns out entirely grey?
Thank you!
