Unlock a world of possibilities! Login now and discover the exclusive benefits awaiting you.
- Qlik Community
- :
- Forums
- :
- Analytics
- :
- App Development
- :
- Re: Color code 3 measures 1 dimension
- Subscribe to RSS Feed
- Mark Topic as New
- Mark Topic as Read
- Float this Topic for Current User
- Bookmark
- Subscribe
- Mute
- Printer Friendly Page
- Mark as New
- Bookmark
- Subscribe
- Mute
- Subscribe to RSS Feed
- Permalink
- Report Inappropriate Content
Color code 3 measures 1 dimension
Hi all!
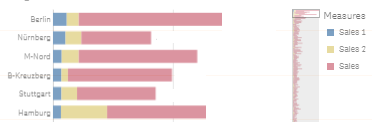
I have a graphic like this, and I would like to put a color to Sales 1 and a color for Sales 2.
I tried to put color by expression, but it only changes all the colors.
Also tried to put the measures into the master item and pick there the color, but when I put them again in the graphic, the color chosen disappears.
Can you please help me with this?
Thank you!
.PNG)
- Mark as New
- Bookmark
- Subscribe
- Mute
- Subscribe to RSS Feed
- Permalink
- Report Inappropriate Content
Hello,
Coloring by expression is only interesting if you want coloring data categorys in Sales 1 or Sales 2.
If you set colors in the master items in the measure you must select coloring by measure in each visualisation you use.
- Mark as New
- Bookmark
- Subscribe
- Mute
- Subscribe to RSS Feed
- Permalink
- Report Inappropriate Content
Go to Appearance - > Color and Legend - > Change to Custom - > Switch On Use Library Colors