Unlock a world of possibilities! Login now and discover the exclusive benefits awaiting you.
- Qlik Community
- :
- Forums
- :
- Analytics
- :
- App Development
- :
- Re: Count and group
- Subscribe to RSS Feed
- Mark Topic as New
- Mark Topic as Read
- Float this Topic for Current User
- Bookmark
- Subscribe
- Mute
- Printer Friendly Page
- Mark as New
- Bookmark
- Subscribe
- Mute
- Subscribe to RSS Feed
- Permalink
- Report Inappropriate Content
Count and group
HIhi,
I have migrated from a hardcore SQL developer to a QLIK user.
I have a set of data where i have different group of department and the list of people working in the department.
I have to find the number of male and female working for each department.
May i know how to set the condition in qlik sense?
Appreaicate your help - thanks.
- Mark as New
- Bookmark
- Subscribe
- Mute
- Subscribe to RSS Feed
- Permalink
- Report Inappropriate Content
Hi Teo,
On a chart, you can do the following:
count(Person_Field)
And put as dimension, the department and male/female field.
This will give you a chart as you need.
Don't know how your data is organised, but that would be a way to do it simply.
Can you share how your data is set?
Lets say as an example you have the following:
Department:
load * Inline
[
Department,EmployeeId
A1,1
A1,2
A2,3
A3,4
A3,5
A3,6
];


Employees:
load * Inline
[
EmployeeId,Sex
1,M
2,M
3,F
4,F
5,F
6,M
];
using the expression count(EmployeeId) you can get a graph like this:
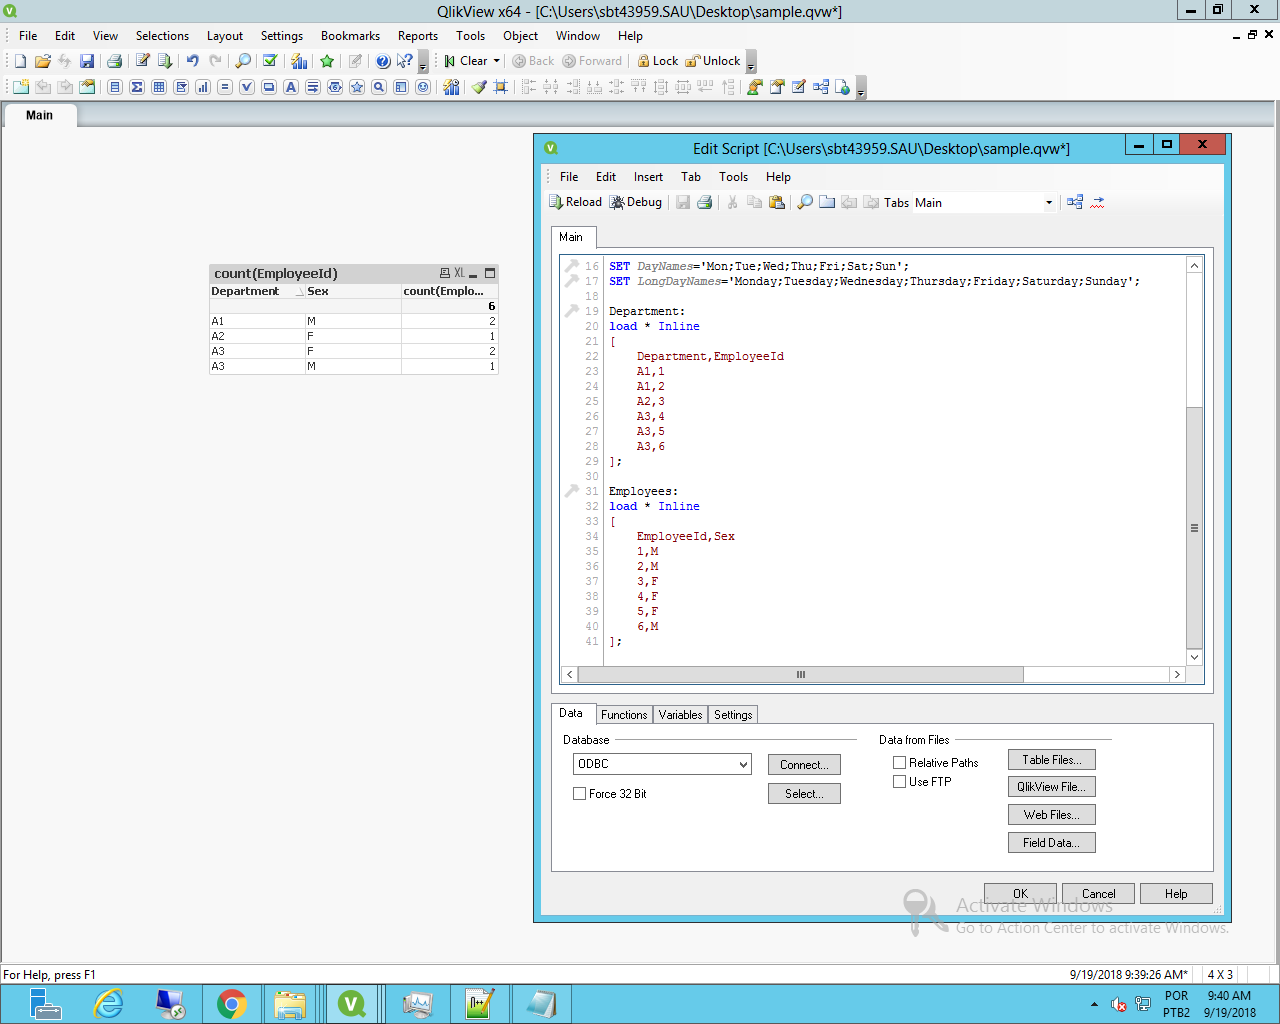
Giving me the count of male/female employees by deparment.
- Mark as New
- Bookmark
- Subscribe
- Mute
- Subscribe to RSS Feed
- Permalink
- Report Inappropriate Content
Hi! It would be best if you provided some sample data file.
Let's say your data has three fields - Department, Name, Gender - then the front end expression would be, e.g. Count({<Gender={'Male'}>}Name) to find the male employees.
- Mark as New
- Bookmark
- Subscribe
- Mute
- Subscribe to RSS Feed
- Permalink
- Report Inappropriate Content
HI guys,
my data is something like that
Department | Gender
Finance | M
Finance | M
Sales | F
Sales | M
Operation | F
Operation | M
The intended result should be
Department | M |F
Finance |2|0
Sales|1|1
Operations|1|1
Hope u get it - thanks.
- Mark as New
- Bookmark
- Subscribe
- Mute
- Subscribe to RSS Feed
- Permalink
- Report Inappropriate Content
HI Teo,
Just do the following:
1. Create a chart (simple table)
2. Add the Department as dimension
3. adds two expression
4. First expression: count({<Gender={"M"}>}Gender)
5. Second expression: First expression: count({<Gender={"F"}>}Gender)
Bolded part is what we call set analysis, so even if you select M/F on the field it will still calculate the same value.
This will give you the desired result.
- Mark as New
- Bookmark
- Subscribe
- Mute
- Subscribe to RSS Feed
- Permalink
- Report Inappropriate Content
Hi Teo,
you can create bar chart including two dimensions "Department" and "Gender" and one measure count(Gender) or you can use a pivot table and put in Department in rows, Gender in columns as dimensions and count(Gender) as a measure.
Thanks