Unlock a world of possibilities! Login now and discover the exclusive benefits awaiting you.
- Qlik Community
- :
- Forums
- :
- Analytics
- :
- App Development
- :
- Re: Create visualisation representing ticket statu...
- Subscribe to RSS Feed
- Mark Topic as New
- Mark Topic as Read
- Float this Topic for Current User
- Bookmark
- Subscribe
- Mute
- Printer Friendly Page
- Mark as New
- Bookmark
- Subscribe
- Mute
- Subscribe to RSS Feed
- Permalink
- Report Inappropriate Content
Create visualisation representing ticket status time
Hi,
This if my first post so apologies for any newbie errors....(!)
I've been working with QlikSense for a number of weeks now. I'm not a programmer or a DB admin at all but I've managed to blunder my way through and have started to create some really useful dashboards based on our PostgreSQL powered ticketing system (Web Help Desk by Solarwinds).
Working for a Managed Service Provider specialising in network infrastructure, I'm really interested in being able to display a bar graph telling be how long our carriers are spending fixing problems. The way that I want to do this is my using my ticketing system, more importantly the ticket status.
I have a number of statuses my tickets can be in e.g
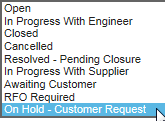
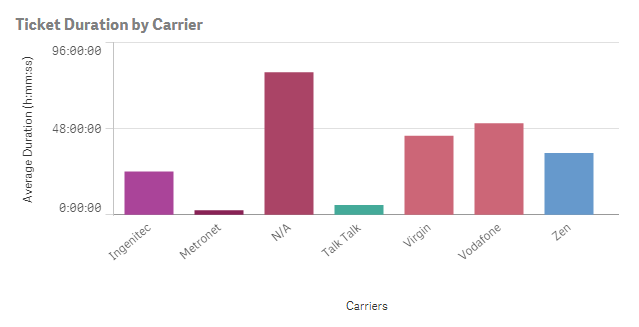
I want to represent how much time each ticket has a status of "In progress with supplier" in a bar graph - something like this:
My database has a table called 'history_entry' which holds all of the status changes in the life of a ticket (plus other stuff). The 'job_ticket_id' is the ticket number:
| job_ticket_id | entry_date | entry_text |
| 15151 | 2015-09-24 17:30:01 | Carrier/Supplier changed from N/A to Ingenitec |
| 15156 | 2015-09-29 17:04:30 | Carrier/Supplier changed from None to Vodafone |
| 15160 | 2015-10-01 17:19:11 | Carrier/Supplier changed from None to N/A |
| 15162 | 2015-10-02 16:27:53 | Carrier/Supplier changed from N/A to Vodafone |
| 15171 | 2015-10-11 12:28:46 | Status changed from In Progress With Supplier to Resolved - Pending Closure |
| 15171 | 2015-10-10 02:43:40 | Status changed from Open to In Progress With Supplier |
| 15176 | 2015-10-21 16:19:13 | Carrier/Supplier changed from None to N/A |
| 15180 | 2015-10-28 13:26:07 | Carrier/Supplier changed from None to N/A |
| 15187 | 2015-11-02 11:01:14 | Status changed from In Progress With Supplier to Closed |
| 15187 | 2015-10-30 13:28:54 | Status changed from Open to In Progress With Supplier |
So for example, in the case of ticket reference 15171 above, the ticket transitions into a status of "In progress with supplier" at 02:43:40 on 10/10, and then moves into a status of "Resolved - pending closure" at 12:28:46 on 11/10. I would therefore want to represent the total time spent in this status in hours (roughly 33 hours in this case). The average this out across all tickets and represent the data per carrier as in the graph above.
If anyone can let me know if the above is possible and if so point me in the right direction I would really appreciate it! If you need any more then please just let me know!
Thanks
Darren
- Mark as New
- Bookmark
- Subscribe
- Mute
- Subscribe to RSS Feed
- Permalink
- Report Inappropriate Content
Hi Darren,
in case of the possible statuses I don't have a functional solution, but a suggestion:
I think you should create 2 additional fields eg. [start_status] and [end_status] with two several loads. These fields could be created via load script. I think the following is the right way:
Starttable:
Load
[supplier],
[job_ticket_id],
[entry_date] as [StartDate],
timestamp(timestamp#([entry_date],'YYYY-MM-DD hh:mm:ss'),'YYYY-MM-DD hh:mm:ss') as [StartTracking],
IF([entry_text]='*from Open to*','Open",
IF([entry_text]='*from In Progress With Supplier*','In Progress With Supplier',
) as [start_status],
From *
where [entry_text] = '*from In Progress With Supplier to*' ; // reduce load to "supplier"-related datasets
Endtable:
Load
[job_ticket_id],
[entry_date] as [EndDate],
timestamp(timestamp#([entry_date],'YYYY-MM-DD hh:mm:ss'),'YYYY-MM-DD hh:mm:ss') as [EndTracking],
IF([entry_text]='*to In Progress With Supplier*','In Progress With Supplier",
IF([entry_text]='*to Resolved','Resolved',
) as [end_status],
Resident Starttable // Resident for using the first table twice
where [entry_text] = '*to In Progress With Supplier*'; // reduce load to "supplier"-related datasets
The created fields StartTracking and EndTracking are convertet from strings to timestamps to calculate them as timestamps.
After that you need to set a set analysis expression in visualisation or as a variable.
=interval([EndTracking] - [StartTracking], 'hh:mm:ss') // or something like that - timestamp substractions are available in other threads 
I don't know if this calculation works with your dataset, but I think with this little suggestion you are able to get in the next step.
Kind regards
T.
- Mark as New
- Bookmark
- Subscribe
- Mute
- Subscribe to RSS Feed
- Permalink
- Report Inappropriate Content
Hi T,
Many thanks for taking the time to respond to my post. Let me have a play with what you've suggested and see what happens!
Thanks
Darren