Unlock a world of possibilities! Login now and discover the exclusive benefits awaiting you.
- Qlik Community
- :
- Forums
- :
- Analytics
- :
- App Development
- :
- Re: Creating an accumulating count by date in a li...
Options
- Subscribe to RSS Feed
- Mark Topic as New
- Mark Topic as Read
- Float this Topic for Current User
- Bookmark
- Subscribe
- Mute
- Printer Friendly Page
Turn on suggestions
Auto-suggest helps you quickly narrow down your search results by suggesting possible matches as you type.
Showing results for
Not applicable
2015-09-23
11:35 AM
- Mark as New
- Bookmark
- Subscribe
- Mute
- Subscribe to RSS Feed
- Permalink
- Report Inappropriate Content
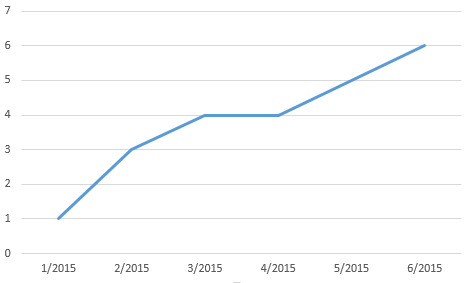
Creating an accumulating count by date in a line chart?
I have data from Salesforce, and want to show the growing monthly total for our contacts, i.e. count(name) for the x-axis value Date(MonthStart(CreatedDate)) plus all dates before it. I could only find answers pertaining to sums, but I'm not counting a numerical value. How can I do this?
Ex.
| ID | Name | CreatedDate |
|---|---|---|
| 209570270 | Name1 | 1/5/15 |
| 235920952 | Name2 | 2/5/15 |
| 252000980 | Name3 | 2/5/15 |
| 345989453 | Name4 | 3/5/15 |
| 340958092 | Name5 | 5/5/15 |
| 235092435 | Name6 | 6/5/15 |
Desired Line Chart
482 Views
1 Solution
Accepted Solutions
2015-09-23
11:52 AM
- Mark as New
- Bookmark
- Subscribe
- Mute
- Subscribe to RSS Feed
- Permalink
- Report Inappropriate Content
Try rangesum(above(count(name),0, rowno()). You'll want to add a dummy record for the missing date too. See attached example.
talk is cheap, supply exceeds demand
361 Views
2 Replies
2015-09-23
11:52 AM
- Mark as New
- Bookmark
- Subscribe
- Mute
- Subscribe to RSS Feed
- Permalink
- Report Inappropriate Content
Try rangesum(above(count(name),0, rowno()). You'll want to add a dummy record for the missing date too. See attached example.
talk is cheap, supply exceeds demand
362 Views
Not applicable
2015-09-23
05:38 PM
Author
- Mark as New
- Bookmark
- Subscribe
- Mute
- Subscribe to RSS Feed
- Permalink
- Report Inappropriate Content
Perfect, thanks!
361 Views
Community Browser