Unlock a world of possibilities! Login now and discover the exclusive benefits awaiting you.
- Qlik Community
- :
- Forums
- :
- Analytics
- :
- App Development
- :
- Re: Cumulative Total - displaying only the last 12...
- Subscribe to RSS Feed
- Mark Topic as New
- Mark Topic as Read
- Float this Topic for Current User
- Bookmark
- Subscribe
- Mute
- Printer Friendly Page
- Mark as New
- Bookmark
- Subscribe
- Mute
- Subscribe to RSS Feed
- Permalink
- Report Inappropriate Content
Cumulative Total - displaying only the last 12 months.
Hi all,
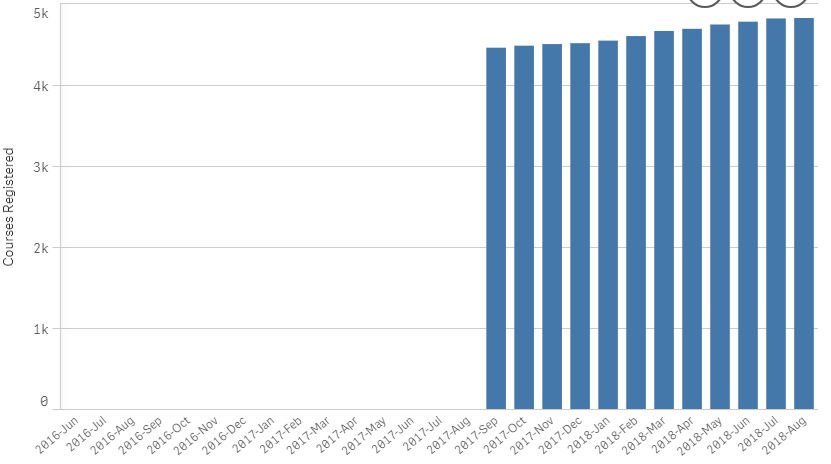
I'm trying to calculate a cumulative total, which counts the total number of courses created since the "beginning", but want to only display the last 12 months on a bar graph.
Noting however, I don't want a running 12 month total, but the accumulative total since the first course was created.
I have tried:
=rangesum(above(TOTAL Count({<[CreatedDate.autoCalendar.Date]=,
[CreatedDate.autoCalendar.Month]=,[CreatedDate.autoCalendar.Year]=,[CreatedDate.autoCalendar.YearMonth]={">=$(=addMonths(max([CreatedDate.autoCalendar.Date]),-12))
<= $(=addmonths(max([CreatedDate.autoCalendar.Date])))"}>}[Name]),0,RowNo()))
While this displays the last 12 months, which is what i want, it only shows the accumulative total of the last 12 months as well; as opposed to the total overall courses created up until that time.
i.e. August-2017 starts from a 0 base, as opposed to a base of 4352.
Please find the data attached.
Many thanks!
C
Accepted Solutions
- Mark as New
- Bookmark
- Subscribe
- Mute
- Subscribe to RSS Feed
- Permalink
- Report Inappropriate Content
Did you try to uncheck 'Include Zero Values' under Add-ons-> Data Handling to remove month with 0 value...
you want to use Month as a dimension instead of YearMonth? Try this
Aggr(RangeSum(Above(TOTAL Count({<[CreatedDate.autoCalendar.Date], [CreatedDate.autoCalendar.Month], [CreatedDate.autoCalendar.Year], [CreatedDate.autoCalendar.YearMonth]>} [Name]), 0, RowNo())), ([CreatedDate.autoCalendar.YearMonth], (NUMERIC)))
- Mark as New
- Bookmark
- Subscribe
- Mute
- Subscribe to RSS Feed
- Permalink
- Report Inappropriate Content
Try this
=RangeSum(Above(TOTAL Count({<[CreatedDate.autoCalendar.Date], [CreatedDate.autoCalendar.Month], [CreatedDate.autoCalendar.Year], [CreatedDate.autoCalendar.YearMonth]>} [Name]), 0, RowNo()))
*
Avg({<[CreatedDate.autoCalendar.YearMonth] = {">=$(=AddMonths(Max([CreatedDate.autoCalendar.Date]), -12))
<=$(=AddMonths(Max([CreatedDate.autoCalendar.Date])))"}>} 1)
- Mark as New
- Bookmark
- Subscribe
- Mute
- Subscribe to RSS Feed
- Permalink
- Report Inappropriate Content
Hey Sunny!
Thank you for this!
The data comes through fine for the Y Axis, but on the dimension's/x axis, its showing all the historical months.
I.e. the Y-Axis is still showing months (with 0 value) from 2015, and then only begins properly populating the data from
I'm using [CreatedDate.autoCalendar.YearMonth] as my dimension, and if i change it to [CreatedDate.autoCalendar.Month] the values aren't right.
FYI - i'm sorting by max([CreatedDate.autoCalendar.YearMonth] )
Thanks again Sunny, really great help!
Chien
- Mark as New
- Bookmark
- Subscribe
- Mute
- Subscribe to RSS Feed
- Permalink
- Report Inappropriate Content
Did you try to uncheck 'Include Zero Values' under Add-ons-> Data Handling to remove month with 0 value...
you want to use Month as a dimension instead of YearMonth? Try this
Aggr(RangeSum(Above(TOTAL Count({<[CreatedDate.autoCalendar.Date], [CreatedDate.autoCalendar.Month], [CreatedDate.autoCalendar.Year], [CreatedDate.autoCalendar.YearMonth]>} [Name]), 0, RowNo())), ([CreatedDate.autoCalendar.YearMonth], (NUMERIC)))
- Mark as New
- Bookmark
- Subscribe
- Mute
- Subscribe to RSS Feed
- Permalink
- Report Inappropriate Content
Thanks for this Sunny!
Just out of curiosity, what is Numeric?
- Mark as New
- Bookmark
- Subscribe
- Mute
- Subscribe to RSS Feed
- Permalink
- Report Inappropriate Content