Unlock a world of possibilities! Login now and discover the exclusive benefits awaiting you.
- Qlik Community
- :
- Forums
- :
- Analytics
- :
- App Development
- :
- Re: Cumulative value in the first element of a dim...
- Subscribe to RSS Feed
- Mark Topic as New
- Mark Topic as Read
- Float this Topic for Current User
- Bookmark
- Subscribe
- Mute
- Printer Friendly Page
- Mark as New
- Bookmark
- Subscribe
- Mute
- Subscribe to RSS Feed
- Permalink
- Report Inappropriate Content
Cumulative value in the first element of a dimension
Hello Experts,
I'm trying to display some data for rolling 12 months, and the first month must include the value of its rolling 12 but I can't figure how to get it.
Sample data:
Sales:
LOAD * INLINE [
Month, Year, Sales, R12
07, 15, 98127, 0
08, 15, 70834, 0
09, 15, 102456, 0
10, 15, 92151, 0
11, 15, 25420, 0
12, 15, 15125, 0
01, 16, 73453, 0
02, 16, 23623, 0
03, 16, 49325, 0
04, 16, 696821, 0
05, 16, 59686, 0
06, 16, 268762, 0
07, 16, 798165, 1
08, 16, 8721312, 1
09, 16, 546848, 1
10, 16, 54231, 1
11, 16, 218723, 1
12, 16, 216787, 1
01, 17, 363135, 1
02, 17, 73781, 1
03, 17, 845945, 1
04, 17, 842907, 1
05, 17, 953567, 1
06, 17, 935689, 1
];
R12 is the flag of Rolling 12
So, I get these data
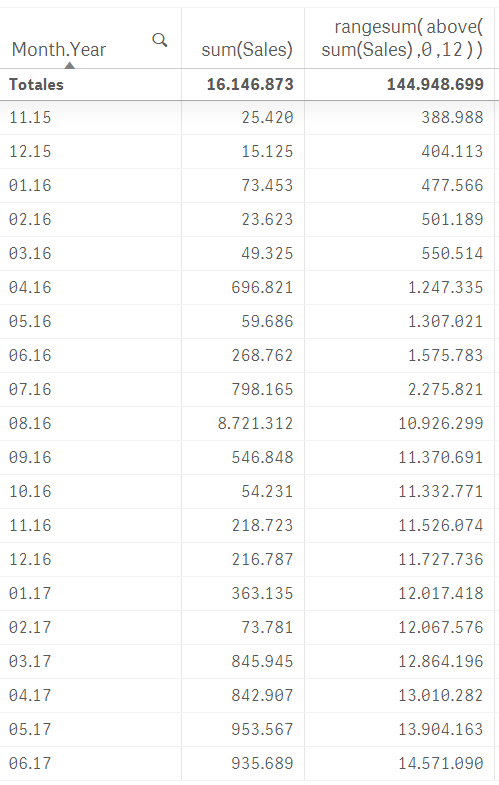
But when I select the rolling 12 Months:
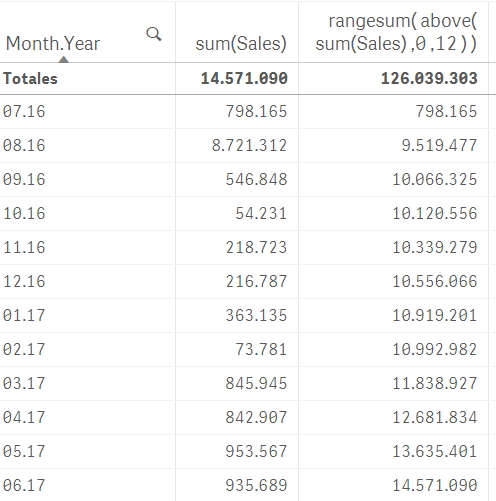
Is there any way to get that the value of 07.16 could be 2.275.821?
Thanks in advance.
PS: I'm using Qlik Sense Desktop 3.2 SR4
Accepted Solutions
- Mark as New
- Bookmark
- Subscribe
- Mute
- Subscribe to RSS Feed
- Permalink
- Report Inappropriate Content
Which field are you making selection in? Month.Year or is it some other month and year field? You have to ignore selection in that field
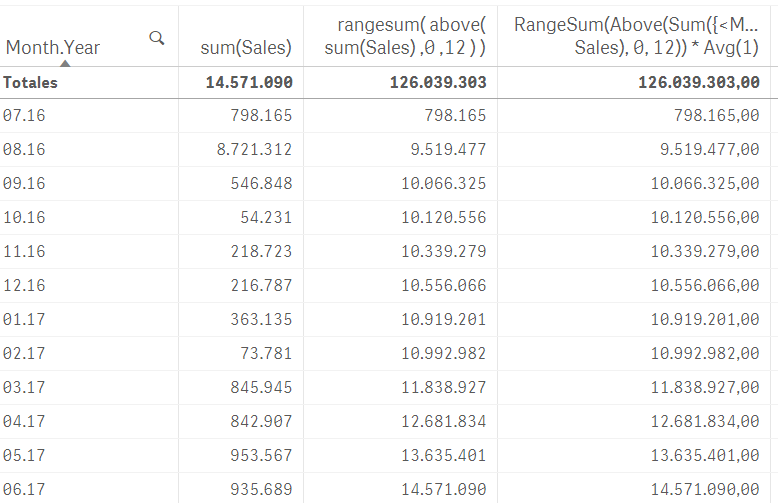
RangeSum(Above(Sum({<Month.Year>} Sales), 0, 12)) * Avg(1)
- Mark as New
- Bookmark
- Subscribe
- Mute
- Subscribe to RSS Feed
- Permalink
- Report Inappropriate Content
Hi,
I feel you should do this in script instead of in chart. Then you will get what you want.
Regards,
Kaushik Solanki
- Mark as New
- Bookmark
- Subscribe
- Mute
- Subscribe to RSS Feed
- Permalink
- Report Inappropriate Content
Thanks for que quick reply. Unfortunately, there is some filters in the sheet (customer, products...), so it should be done in chart.
- Mark as New
- Bookmark
- Subscribe
- Mute
- Subscribe to RSS Feed
- Permalink
- Report Inappropriate Content
Try this
RangeSum(Above(Sum({<Month.Year>} Sales), 0, 12)) * Avg(1)
- Mark as New
- Bookmark
- Subscribe
- Mute
- Subscribe to RSS Feed
- Permalink
- Report Inappropriate Content
Thanks for your answer Sunny, I get the same values
- Mark as New
- Bookmark
- Subscribe
- Mute
- Subscribe to RSS Feed
- Permalink
- Report Inappropriate Content
Which field are you making selection in? Month.Year or is it some other month and year field? You have to ignore selection in that field
RangeSum(Above(Sum({<Month.Year>} Sales), 0, 12)) * Avg(1)
- Mark as New
- Bookmark
- Subscribe
- Mute
- Subscribe to RSS Feed
- Permalink
- Report Inappropriate Content
Thank you very much, Sunny.
RangeSum(Above(Sum({<Month.Year, R12>} Sales), 0, 12)) * Avg(1)
And supress zero values did the trick!