Unlock a world of possibilities! Login now and discover the exclusive benefits awaiting you.
- Qlik Community
- :
- Forums
- :
- Analytics
- :
- App Development
- :
- Custom KML in Qlik Sense 1.1
- Subscribe to RSS Feed
- Mark Topic as New
- Mark Topic as Read
- Float this Topic for Current User
- Bookmark
- Subscribe
- Mute
- Printer Friendly Page
- Mark as New
- Bookmark
- Subscribe
- Mute
- Subscribe to RSS Feed
- Permalink
- Report Inappropriate Content
Custom KML in Qlik Sense 1.1
Hi there,
I've got several kml files which store different floor plans of different stores broken down by department. I mean each kml stores the coordinates of the departments of each store.
Then I import these files into Qlik Sense 1.1 and concate them into a single table which looks like this:
| id_department | area |
|---|---|
| 1 | [[[[1,1],[2,1],[2,2],[1,2],[1,1]]]] |
I also have another table where the stores are related with their departments, e.g.:
| id_store | id_department |
|---|---|
| 1 | 1 |
When I use the Map tool to show the floor plan for a selected store, it happens that the polygons (of all departments of all stores) are overlapped like this case (2 stores overlapping):
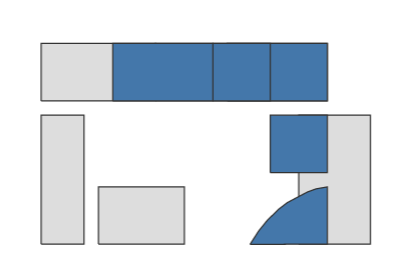
Is this a bug/limit of the Map tool?
- Mark as New
- Bookmark
- Subscribe
- Mute
- Subscribe to RSS Feed
- Permalink
- Report Inappropriate Content
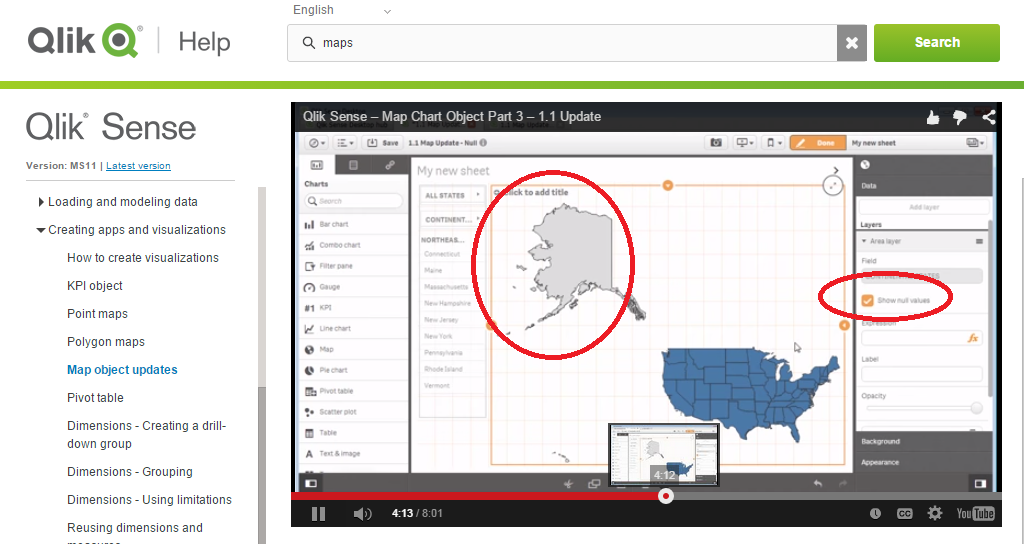
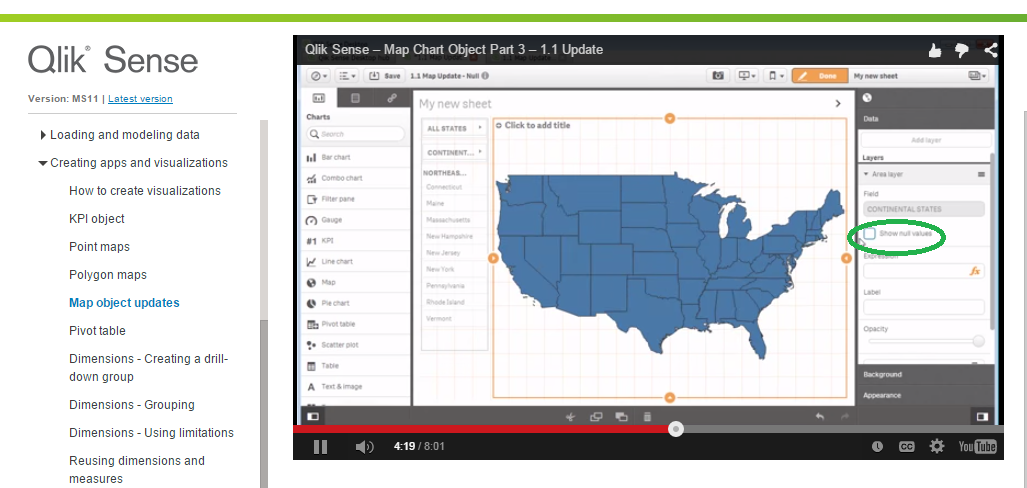
I wonder if this is a question of you unchecking 'show nulls'.
There is a nice video covering this new feature (new for 1.1) in the help. Below are 2 snapshots from the video to help you
- Mark as New
- Bookmark
- Subscribe
- Mute
- Subscribe to RSS Feed
- Permalink
- Report Inappropriate Content
Unfortunately it is not an issue with null values. In fact in the tutorial they have a geo-map, which states are never overlapping, on the other hand the floor plans may have the same coordinates and overlapping elements.
Here a screen without the flag on null values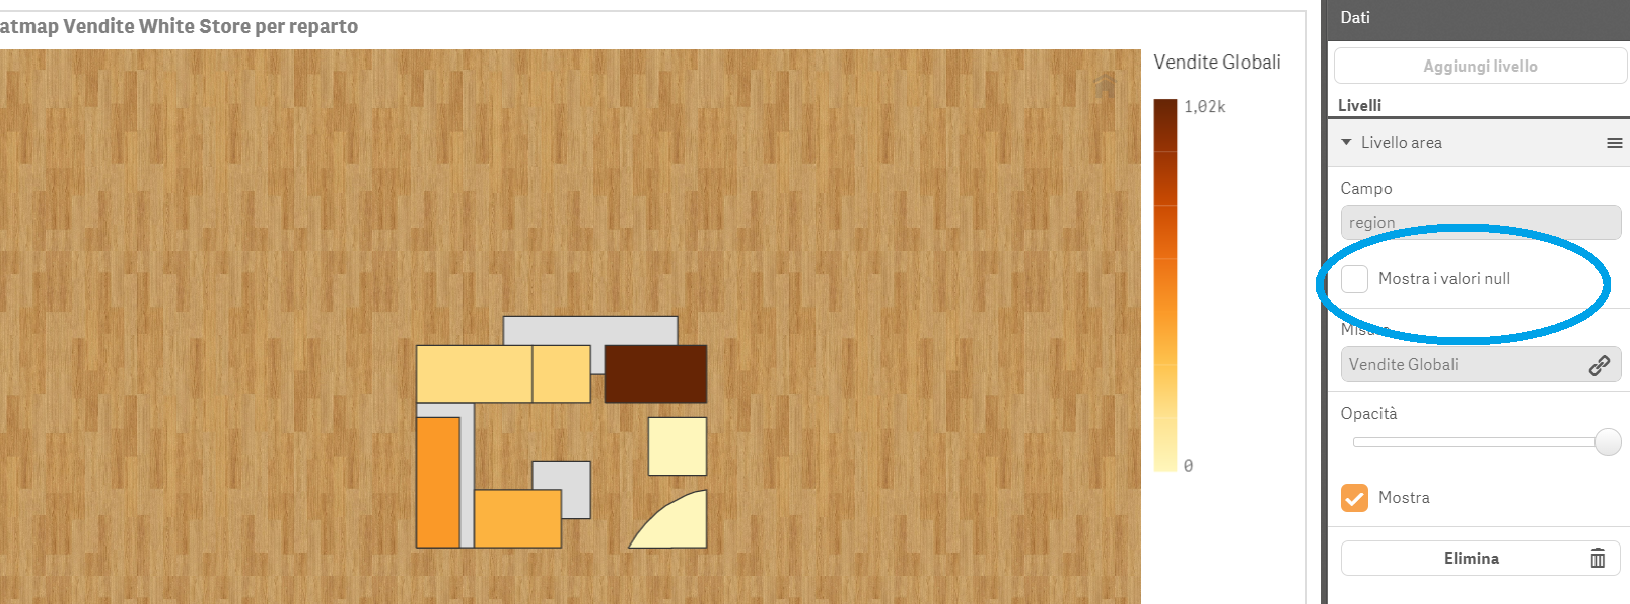
- Mark as New
- Bookmark
- Subscribe
- Mute
- Subscribe to RSS Feed
- Permalink
- Report Inappropriate Content
Are you using this KML with any other tool? Did you create it yourself? Could you share it to take a look at it?
My guess is that if in the map object you see objects overlapping, they do have similar coordinates that make it happen.
- Mark as New
- Bookmark
- Subscribe
- Mute
- Subscribe to RSS Feed
- Permalink
- Report Inappropriate Content
The KML are floor plans so it's very likely that they'll have similar coordinates.
These files would be created with CAD et similia and converted back into KML.
In this case I created the sample KMLs by myself and concatenated them into a single table when imported into Qlik Sense:
| plan_b.kml |
|---|
<?xml version="1.0" encoding="UTF-8"?> <kml xmlns="http://www.opengis.net/kml/2.2"> <Document> <name>Store</name> <open>1</open> <Folder> <name>Black</name> <visibility>0</visibility> <LookAt> <longitude>0</longitude> <latitude>0</latitude> <altitude>0</altitude> </LookAt>
<Placemark> <name>B9407F30-F5F8-466E-AFF9-25556B57FE7D11</name> <visibility>0</visibility> <styleUrl>#transRedPoly</styleUrl> <Polygon> <extrude>1</extrude> <altitudeMode>relativeToGround</altitudeMode> <outerBoundaryIs> <LinearRing> <coordinates> 1,1,10 3,1,10 3,6,10 1,6,10 1,1,10 </coordinates> </LinearRing> </outerBoundaryIs> </Polygon> </Placemark>
<Placemark> <name>B9407F30-F5F8-466E-AFF9-25556B57FE7D21</name> <visibility>0</visibility> <styleUrl>#transRedPoly</styleUrl> <Polygon> <extrude>1</extrude> <altitudeMode>relativeToGround</altitudeMode> <outerBoundaryIs> <LinearRing> <coordinates> 4,7,10 10,7,10 10,9,10 4,9,010 4,7,10 </coordinates> </LinearRing> </outerBoundaryIs> </Polygon> </Placemark>
<Placemark> <name>B9407F30-F5F8-466E-AFF9-25556B57FE7D31</name> <visibility>0</visibility> <styleUrl>#transRedPoly</styleUrl> <Polygon> <extrude>1</extrude> <altitudeMode>relativeToGround</altitudeMode> <outerBoundaryIs> <LinearRing> <coordinates> 5,2,10 7,2,10 7,4,10 5,4,10 5,2,10 </coordinates> </LinearRing> </outerBoundaryIs> </Polygon> </Placemark>
</Folder>
</Document> </kml> |
| plan_w.kml |
|---|
<?xml version="1.0" encoding="UTF-8"?> <kml xmlns="http://www.opengis.net/kml/2.2"> <Document> <name>Store</name> <open>1</open> <Folder> <name>White</name> <visibility>0</visibility> <LookAt> <longitude>0</longitude> <latitude>0</latitude> <altitude>0</altitude> </LookAt>
<Placemark> <name>B9407F30-F5F8-466E-AFF9-25556B57FE6D991</name> <visibility>0</visibility> <styleUrl>#transRedPoly</styleUrl> <Polygon> <extrude>1</extrude> <altitudeMode>relativeToGround</altitudeMode> <outerBoundaryIs> <LinearRing> <coordinates> 8.3,0.99,10 11,1,10 11,3,10 10.6,2.93,10 10.3,2.82,10 9.6,2.45,10 9.3,2.22,10 8.9,1.83,10 8.6,1.46,10 8.3,0.99,10 </coordinates> </LinearRing> </outerBoundaryIs> </Polygon> </Placemark>
<Placemark> <name>B9407F30-F5F8-466E-AFF9-25556B57FE6D9999</name> <visibility>0</visibility> <styleUrl>#transRedPoly</styleUrl> <Polygon> <extrude>1</extrude> <altitudeMode>relativeToGround</altitudeMode> <outerBoundaryIs> <LinearRing> <coordinates> 9,3.5,10 11,3.5,10 11,5.5,10 9,5.5,10 9,3.5,10 </coordinates> </LinearRing> </outerBoundaryIs> </Polygon> </Placemark>
<Placemark> <name>B9407F30-F5F8-466E-AFF9-25556B57FE6D11</name> <visibility>0</visibility> <styleUrl>#transRedPoly</styleUrl> <Polygon> <extrude>1</extrude> <altitudeMode>relativeToGround</altitudeMode> <outerBoundaryIs> <LinearRing> <coordinates> 1,1,10 2.5,1,10 2.5,5.5,10 1,5.5,10 1,1,10 </coordinates> </LinearRing> </outerBoundaryIs> </Polygon> </Placemark>
<Placemark> <name>B9407F30-F5F8-466E-AFF9-25556B57FE6D12</name> <visibility>0</visibility> <styleUrl>#transRedPoly</styleUrl> <Polygon> <extrude>1</extrude> <altitudeMode>relativeToGround</altitudeMode> <outerBoundaryIs> <LinearRing> <coordinates> 3,1,10 6,1,10 6,3,10 3,3,10 3,1,10 </coordinates> </LinearRing> </outerBoundaryIs> </Polygon> </Placemark>
<Placemark> <name>B9407F30-F5F8-466E-AFF9-25556B57FE6D21</name> <visibility>0</visibility> <styleUrl>#transRedPoly</styleUrl> <Polygon> <extrude>1</extrude> <altitudeMode>relativeToGround</altitudeMode> <outerBoundaryIs> <LinearRing> <coordinates> 1,6,10 5,6,10 5,8,10 1,8,10 1,6,10 </coordinates> </LinearRing> </outerBoundaryIs> </Polygon> </Placemark>
<Placemark> <name>B9407F30-F5F8-466E-AFF9-25556B57FE6D22</name> <visibility>0</visibility> <styleUrl>#transRedPoly</styleUrl> <Polygon> <extrude>1</extrude> <altitudeMode>relativeToGround</altitudeMode> <outerBoundaryIs> <LinearRing> <coordinates> 5,6,10 7,6,10 7,8,10 5,8,10 5,6,10 </coordinates> </LinearRing> </outerBoundaryIs> </Polygon> </Placemark>
<Placemark> <name>B9407F30-F5F8-466E-AFF9-25556B57FE6D23</name> <visibility>0</visibility> <styleUrl>#transRedPoly</styleUrl> <Polygon> <extrude>1</extrude> <altitudeMode>relativeToGround</altitudeMode> <outerBoundaryIs> <LinearRing> <coordinates> 7.5,6,10 11,6,10 11,8,10 7.5,8,10 7.5,6,10 </coordinates> </LinearRing> </outerBoundaryIs> </Polygon> </Placemark> </Folder>
</Document> </kml> |
PLANS:
LOAD
plan_w.Name as id_dept,
plan_w.Area as area
FROM [lib://Drive/plan_w.kml]
(kml, Table is [Store/White]);
CONCATENATE(PLANS)
LOAD
plan_b.Name as id_dept,
plan_b.Area as area
FROM [lib://Drive/plan_b.kml]
(kml, Table is [Store/Black]);
- Mark as New
- Bookmark
- Subscribe
- Mute
- Subscribe to RSS Feed
- Permalink
- Report Inappropriate Content
Hi Matteo,
This is not a bug!
The map displays correctly the data in kml files. The vertices of the two floor plans in kml files are overlapping, therefore the two plans should be overlapped in the map. You can verify this by using Google Earth to display your two kml files.
You should also notice that the vertices/points in kml files are in WGS84 coordinate systems. Therefore, before being rendered to the map, they are projected under the Mercator transform.
Regards,
Quan
- Mark as New
- Bookmark
- Subscribe
- Mute
- Subscribe to RSS Feed
- Permalink
- Report Inappropriate Content
Hi Quan,
I really appreciate your help.
Right now I would like to display the different kml dynamically and without overlapping objects.
I guessed that qlik draws the map only of the elements selected and redraws it every time, but this is not the case.
Do you have any idea to solve this issue?
In this specific example I have a table (from KML files) where I store the coordinates (some overlapping) of all the departments of 2 retail stores (black, white). Furhter, I want to display on the same map the floor plan of each store showing only the one selected.
Regards,
Matteo
- Mark as New
- Bookmark
- Subscribe
- Mute
- Subscribe to RSS Feed
- Permalink
- Report Inappropriate Content
Hi Matteo,
In script editor, you add one more field, let say 'plan' as illustrated below, and use this field to select what plan you want to high light in the map:
PLANS:
LOAD
'White' as plan,
plan_w.Name as id_dept,
plan_w.Area as area
FROM [lib://map/plan_w.kml]
(kml, Table is [Store/White]);
CONCATENATE(PLANS)
LOAD
'Black' as plan,
plan_b.Name as id_dept,
plan_b.Area as area
FROM [lib://map/plan_b.kml]
(kml, Table is [Store/Black]);
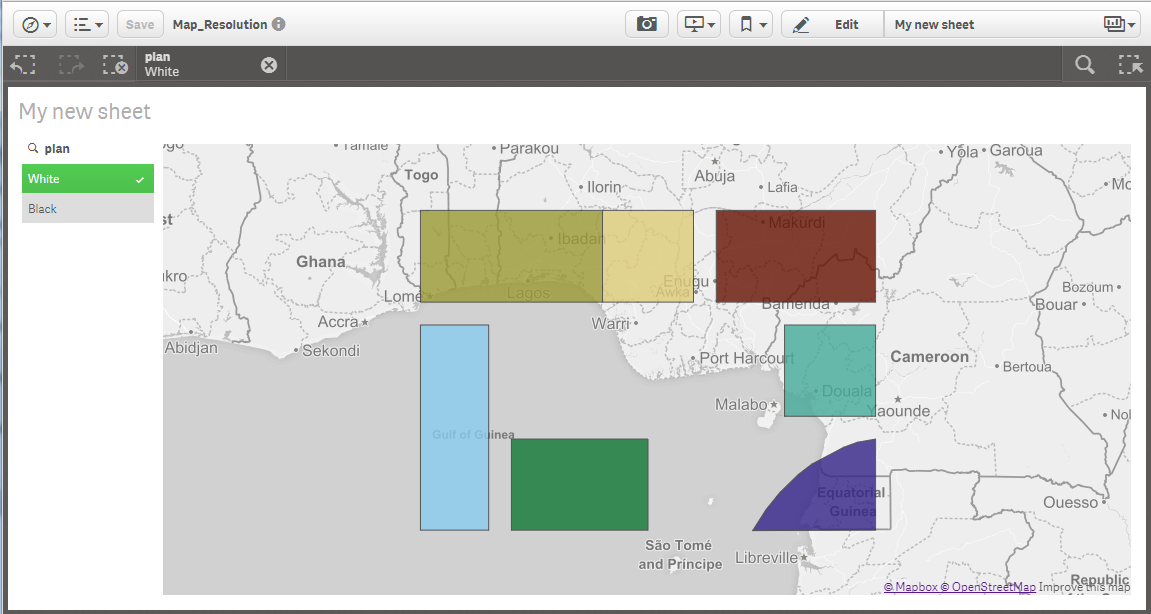
Currently the map shows all items, not only selected items. However, this option (i.e. show only selected items as illustrated in the above picture) is in our road map.
Regards,
- Mark as New
- Bookmark
- Subscribe
- Mute
- Subscribe to RSS Feed
- Permalink
- Report Inappropriate Content
Hi Matteo Di Pierro,
How do you create the office plan? It sounds great to apply but I can't create a effectiveness floor.kml to use in Qlik Sense...
Many thanks!