Unlock a world of possibilities! Login now and discover the exclusive benefits awaiting you.
- Qlik Community
- :
- Forums
- :
- Analytics
- :
- App Development
- :
- Custom Labels For Dynamic Drill Down Dymension
- Subscribe to RSS Feed
- Mark Topic as New
- Mark Topic as Read
- Float this Topic for Current User
- Bookmark
- Subscribe
- Mute
- Printer Friendly Page
- Mark as New
- Bookmark
- Subscribe
- Mute
- Subscribe to RSS Feed
- Permalink
- Report Inappropriate Content
Custom Labels For Dynamic Drill Down Dymension
Hi All!
I have to make a cyclic dimension-like solution at a table (Qlik Sense 1.1).
I have downloaded an extension (Variable Button), with I am able to make a cyclic dimension.
If I add a drill-down dimension to the table, I'll get the function as a label.
The drill down hierarchy:
level 1: if($(var)=1,'A dimension','B dimension')
level 2: if($(var)=1,'Aa dimension','Bb dimension')
The label become e.g. : if($(var)=1,'A dimension','B dimension').
As far as I know there isn't solution for the mentioned problem, I'm curios do you suggest any workaround for cyclic dimension in Qlik Sense (as far I didn't find any solution, that fits).
Thank you!
G.
- « Previous Replies
-
- 1
- 2
- Next Replies »
- Mark as New
- Bookmark
- Subscribe
- Mute
- Subscribe to RSS Feed
- Permalink
- Report Inappropriate Content
drill downs in sense are created through masteritems dimensions unfortunately we cannot use master items expressions so the combination of cyclical and drill downfunctionality is out of reach. I'd suggest using the method your using with the 4 options available to the user rather than filter drill downs.
I think you have the way to do this covered but I'll add a link to how I've down it in the past
- Mark as New
- Bookmark
- Subscribe
- Mute
- Subscribe to RSS Feed
- Permalink
- Report Inappropriate Content
Hi Andy!
The linked documennt is very nice and useful, but doesn't cover my problem.
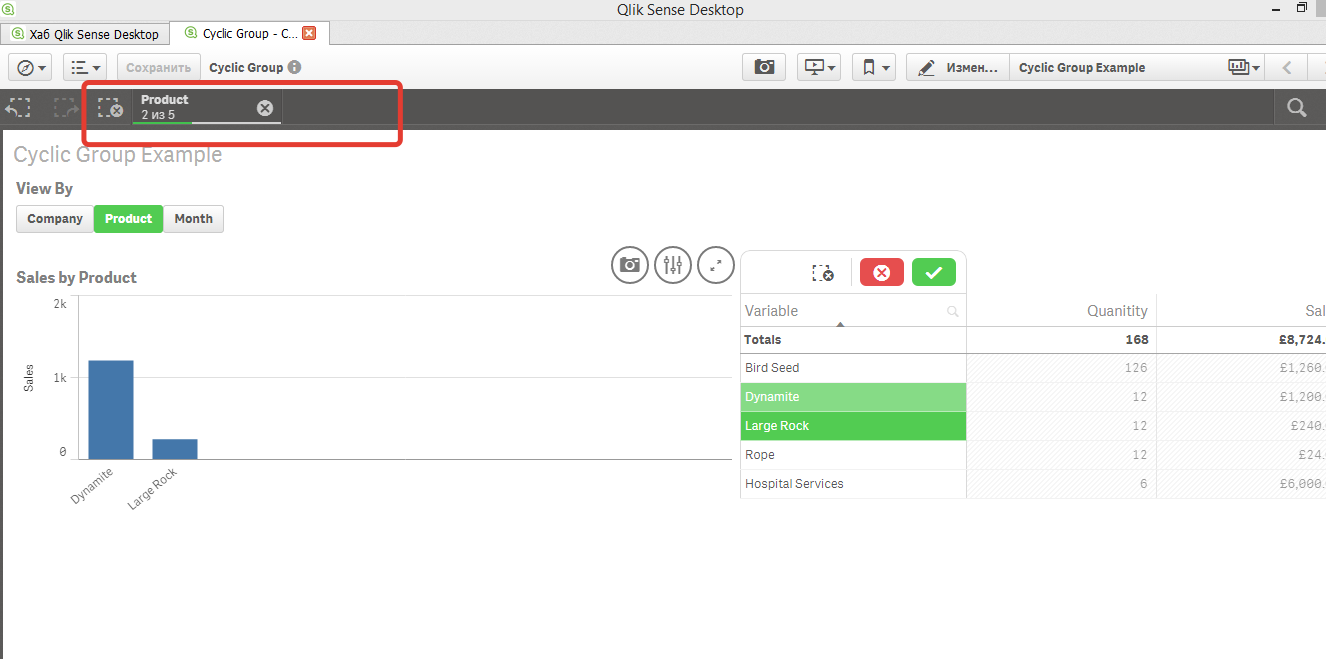
The main problem is, like the attached qvf at Makes Sense to go round in circles, filter works fine, altough the filter band shows the formula instead of label.
G.
- Mark as New
- Bookmark
- Subscribe
- Mute
- Subscribe to RSS Feed
- Permalink
- Report Inappropriate Content
The filter bar will always show the formula. this is by design. The filter bar displays filters applied to the underlying data model not a specific chart. For that reason your chart label will not show in the filter bar as this would be confusing if for example you named dimensions, measures differently in different charts. How would a user know which chart the filter was applied from? and as it filtered the model as a whole would they care?
- Mark as New
- Bookmark
- Subscribe
- Mute
- Subscribe to RSS Feed
- Permalink
- Report Inappropriate Content
OK, I understand, but I think it is unacceptable from the client side. They only want to see fancy labels instead of functions.
Thank you for the information!
G.
- Mark as New
- Bookmark
- Subscribe
- Mute
- Subscribe to RSS Feed
- Permalink
- Report Inappropriate Content
Andy Weir написал(а):
The filter bar will always show the formula. this is by design. The filter bar displays filters applied to the underlying data model not a specific chart. For that reason your chart label will not show in the filter bar as this would be confusing if for example you named dimensions, measures differently in different charts. How would a user know which chart the filter was applied from? and as it filtered the model as a whole would they care?
Hi, Andy.
Actually, I believe that with minor tweak in the formula for cyclic dimension in your sample application we can get result required by @undergrinder
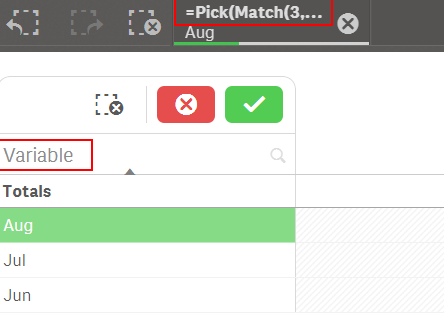
For this I changed formula from:
Pick(Match($(vSalesView),1,2,3),'Company','Product','Month')
=$(=Pick(Match($(vSalesView),1,2,3),'Company','Product','Month'))
to:
=$(=Pick(Match($(vSalesView),1,2,3),'Company','Product','Month'))
BTW, I used similar technic here: Emulating cyclic dimension group in Qlik Sense Desktop
- Mark as New
- Bookmark
- Subscribe
- Mute
- Subscribe to RSS Feed
- Permalink
- Report Inappropriate Content
nice tweak I'll update my document accordingly?
- Mark as New
- Bookmark
- Subscribe
- Mute
- Subscribe to RSS Feed
- Permalink
- Report Inappropriate Content
Yes, of course.
- Mark as New
- Bookmark
- Subscribe
- Mute
- Subscribe to RSS Feed
- Permalink
- Report Inappropriate Content
Hi Vadim,
The cycleic dimension is known by me, this is not exactly, what I want, but I'll try the =$(=...) formula for drill down dimension.
G.
- Mark as New
- Bookmark
- Subscribe
- Mute
- Subscribe to RSS Feed
- Permalink
- Report Inappropriate Content
Hi, undergrinder.
I do not know your actual requirements, this tweak just solves the problem that you wrote about:
Hi Andy!
The linked documennt is very nice and useful, but doesn't cover my problem.
The main problem is, like the attached qvf at Makes Sense to go round in circles, filter works fine, altough the filter band shows the formula instead of label.
G.
- « Previous Replies
-
- 1
- 2
- Next Replies »